Lesson 1

Marketing Analytics
Nanodegree Program
Gain foundational data skills applicable to marketing. Collect and analyze data, model marketing scenarios, and communicate your findings with Excel, and Tableau.
Gain foundational data skills applicable to marketing. Collect and analyze data, model marketing scenarios, and communicate your findings with Excel, and Tableau.
Beginner
2 months
Real-world Projects
Completion Certificate
Last Updated June 18, 2024
Skills you'll learn:
Prerequisites:
No experience required
Courses In This Program
Course 1 • 32 minutes
Welcome to the Nanodegree
Lesson 1
Welcome to Marketing Analytics
Lesson 2
Getting Help
You are starting a challenging but rewarding journey! Take 5 minutes to read how to get help with projects and content.
Lesson 3
Get Help with Your Account
What to do if you have questions about your account or general questions about the program.
Course 2 • 2 weeks
Introduction to Data
Lesson 1
Descriptive Statistics - Part I
In this lesson, you will learn about data types, measures of center, and the basics of statistical notation.
Lesson 2
Descriptive Statistics - Part II
In this lesson, you will learn about measures of spread, shape, and outliers as associated with quantitative data. You will also get a first look at inferential statistics.
Lesson 3
Spreadsheets 1: Getting Started
In this lesson, you will learn about the basic functionality for spreadsheet software, use cell referencing and menu shortcuts.
Lesson 4 • Project
Project: Working with Data
Lesson 5
Spreadsheets 2: Manipulate Data
In this lesson, you will learn basic spreadsheet function: sort and filter data, use text and math functions, split columns and remove duplicates.
Lesson 6
Spreadsheets 3: Analyze Data
In this lesson, you will learn how to summarize data with aggregation and conditional functions. You will learn how to use pivot tables and lookup functions.
Lesson 7
Spreadsheets 4: Visualize Data
In this lesson you will build data visualizations for quantitative and categorical data; create pie, bar, line, scatter, histogram, and boxplot charts, and build professional presentations.
Lesson 8 • Project
Project: Analyze Survey Data
Course 3 • 2 weeks
Data Visualization
Learn how to select the most appropriate data visualization for an analysis. Learn how to evaluate the effectiveness of a data visualization and build interactive and engaging Tableau dashboards.
Lesson 1
Data Visualization Fundamentals
In this lesson you learn to evaluate the quality of data visualizations and build high quality visualizations, starting with the fundamentals of data dashboards.
Lesson 2
Design Principles
In this lesson you learn to implement the best design practices, and to use the most appropriate chart for a particular situation.
Lesson 3 • Project
Project - Storytelling With Data
Lesson 4
Creating Visualizations in Tableau
This lesson teaches you how to build data visualizations in Tableau using data hierarchies, filters, groups, sets, and calculated fields, as well as create map-based data visualizations in Tableau.
Lesson 5
Telling Stories with Tableau
In this lesson you learn how to build interactive Tableau dashboards and tell impactful stories using data.
Lesson 6 • Project
Build a Data Visualization project
In this project, you’ll build interactive dashboards with Tableau and use them to discover and communicate insights from data.
Course 4 • 2 weeks
Marketing Analytics Techniques
Lesson 1
Introduction to Marketing Analytics
Lesson 2
Metrics That Matter
Lesson 3 • Project
Project: Crafting an Analytic Brief
Lesson 4
Analyzing Marketing Data
Lesson 5
Macro Digital Analysis
Lesson 6 • Project
Project: Create a Proposal for the Next Quarter
Taught By The Best

Brad Batesole
Marketing Executive
Brad is a marketing executive who has led teams of top marketers at top companies; Lynda.com, TMZ, LegalZoom, and LinkedIn. He has extensive experience from every angle, from marketing strategy and user experience to social media, paid media, and SEO.

Anke Audenaert
Instructor
Anke led the development of Digital Marketing programs at Udacity. She previously ran Market Research at Yahoo!, co-founded two companies, and is on the marketing faculty at UCLA Anderson.

Mat Leonard
Content Developer
Mat is a former physicist, research neuroscientist, and data scientist. He did his PhD and Postdoctoral Fellowship at the University of California, Berkeley.

Dana Sheahen
Content Developer
Dana is an electrical engineer with a Masters in Computer Science from Georgia Tech. Her work experience includes software development for embedded systems in the Automotive Group at Motorola, where she was awarded a patent for an onboard operating system.

Josh Bernhard
Data Scientist at Nerd Wallet
Josh has been sharing his passion for data for nearly a decade at all levels of university, and as Lead Data Science Instructor at Galvanize. He's used data science for work ranging from cancer research to process automation.
Ratings & Reviews
Average Rating: 4.6 Stars
223 Reviews
Diana V.
March 9, 2023
I am learning a lot about data analysis and visualization. Really helpful in my daily job.
Kyaw T.
February 5, 2023
The reviewers are very picky. I don't like that. They refused to review my work just because I missed one or two things. They shouldn't do that. That's disrespectful. They should consider the stress, time, and brain energy I put in.
Nouran K.
September 13, 2022
so far so good :)
Ahmed E.
June 3, 2022
Awesome Project, very diverse content
Armin R.
May 24, 2022
I miss the mentor
The Udacity Difference
Combine technology training for employees with industry experts, mentors, and projects, for critical thinking that pushes innovation. Our proven upskilling system goes after success—relentlessly.

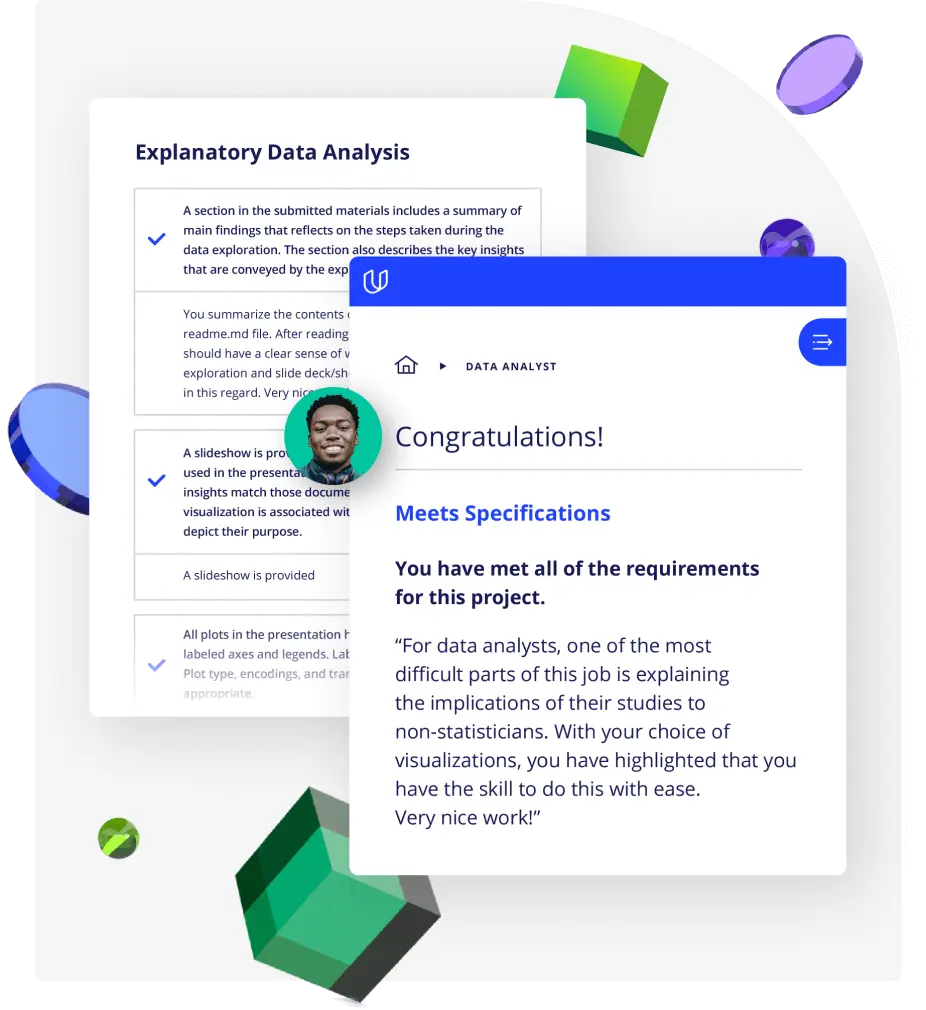
Demonstrate proficiency with practical projects
Projects are based on real-world scenarios and challenges, allowing you to apply the skills you learn to practical situations, while giving you real hands-on experience.
Gain proven experience
Retain knowledge longer
Apply new skills immediately

Top-tier services to ensure learner success
Reviewers provide timely and constructive feedback on your project submissions, highlighting areas of improvement and offering practical tips to enhance your work.
Get help from subject matter experts
Learn industry best practices
Gain valuable insights and improve your skills

Unlock access to Marketing Analytics and the rest of our best-in-class catalog
Unlimited access to our top-rated courses
Real-world projects
Personalized project reviews
Program certificate
Proven career outcomes
Cancel anytime
Full Catalog Access
One subscription opens up this course and our entire catalog of projects and skills.
Month-To-Month
4 Months
*Average time to complete a Nanodegree program
Your subscription also includes:
Your subscription also includes:
(957)
6 months
, Beginner
(1194)
2 months
, Beginner
4 weeks
, Beginner
3 weeks
, Beginner
(124)
5 months
, Beginner
4 weeks
, Beginner
(11)
4 weeks
, Beginner
4 weeks
, Beginner
3 months
, Beginner
3 months
, Beginner
(16)
2 months
, Beginner
(672)
2 months
, Beginner
(272)
2 months
, Intermediate
(807)
2 months
, Beginner
(88)
3 months
, Beginner
4 weeks
, Beginner

Get Started Today
Marketing Analytics
Month-To-Month
- Unlimited access to our top-rated courses
- Real-world projects
- Personalized project reviews
- Program certificates
- Proven career outcomes
4 Months
- All the same great benefits in our month-to-month plan
- Most cost-effective way to acquire a new set of skills
Related Programs
Related Programs
(957)
6 months
, Beginner
(1194)
2 months
, Beginner
4 weeks
, Beginner
3 weeks
, Beginner
(124)
5 months
, Beginner
4 weeks
, Beginner
(11)
4 weeks
, Beginner
4 weeks
, Beginner
3 months
, Beginner
3 months
, Beginner
(16)
2 months
, Beginner
(672)
2 months
, Beginner
(272)
2 months
, Intermediate
(807)
2 months
, Beginner
(88)
3 months
, Beginner
4 weeks
, Beginner


