Lesson 1
Descriptive Statistics - Part I
In this lesson, you will learn about data types, measures of center, and the basics of statistical notation.

Course
Learn the basic concepts of data analysis and descriptive statistics. Learn how to manipulate, analyze and visualize data in Excel and Google Sheets. Learn about business metrics across a wide range of business areas (marketing, sales, growth and finance). Finally, learn about forecasting sales and financial metrics.
Learn the basic concepts of data analysis and descriptive statistics. Learn how to manipulate, analyze and visualize data in Excel and Google Sheets. Learn about business metrics across a wide range of business areas (marketing, sales, growth and finance). Finally, learn about forecasting sales and financial metrics.
Beginner
3 weeks
Real-world Projects
Completion Certificate
Last Updated July 11, 2024
Skills you'll learn:
Prerequisites:
No experience required
Lesson 1
In this lesson, you will learn about data types, measures of center, and the basics of statistical notation.
Lesson 2
In this lesson, you will learn about measures of spread, shape, and outliers as associated with quantitative data. You will also get a first look at inferential statistics.
Lesson 3
In this lesson, you will learn about the basic functionality for spreadsheet software, use cell referencing and menu shortcuts.
Lesson 4
In this lesson, you will learn basic spreadsheet function: sort and filter data, use text and math functions, split columns and remove duplicates.
Lesson 5
In this lesson, you will learn how to summarize data with aggregation and conditional functions. You will learn how to use pivot tables and lookup functions.
Lesson 6
In this lesson you will build data visualizations for quantitative and categorical data; create pie, bar, line, scatter, histogram, and boxplot charts, and build professional presentations.
Lesson 7
This lesson will cover how to calculate business metrics used by business analysts across a range of business functions. You will also learn how to calculate and interpret key performance metrics.
Lesson 8
This lesson will cover the fundamentals of sales and financial forecasting models. You will learn how to create forecast models using advanced lookup and data validation tools in Excel and Sheets.
Lesson 9 • Project
In this project, you will use a data set containing financial performance data from companies listed in NYSE S&P to create an income statement and forecast financial metrics.

Staff Data Scientist
Josh has been sharing his passion for data for over a decade. He's used data science for work ranging from cancer research to process automation. He recently has found a passion for solving data science problems within marketplace companies.

Instructor
Ruchi is a data scientist with over a decade of experience in research and industry. She received her PhD from University of Illinois at Urbana-Champaign. She has taught at the University level and designs online learning content within the ed-tech industry.

Content Developer
Dana is an electrical engineer with a Masters in Computer Science from Georgia Tech. Her work experience includes software development for embedded systems in the Automotive Group at Motorola, where she was awarded a patent for an onboard operating system.
Combine technology training for employees with industry experts, mentors, and projects, for critical thinking that pushes innovation. Our proven upskilling system goes after success—relentlessly.

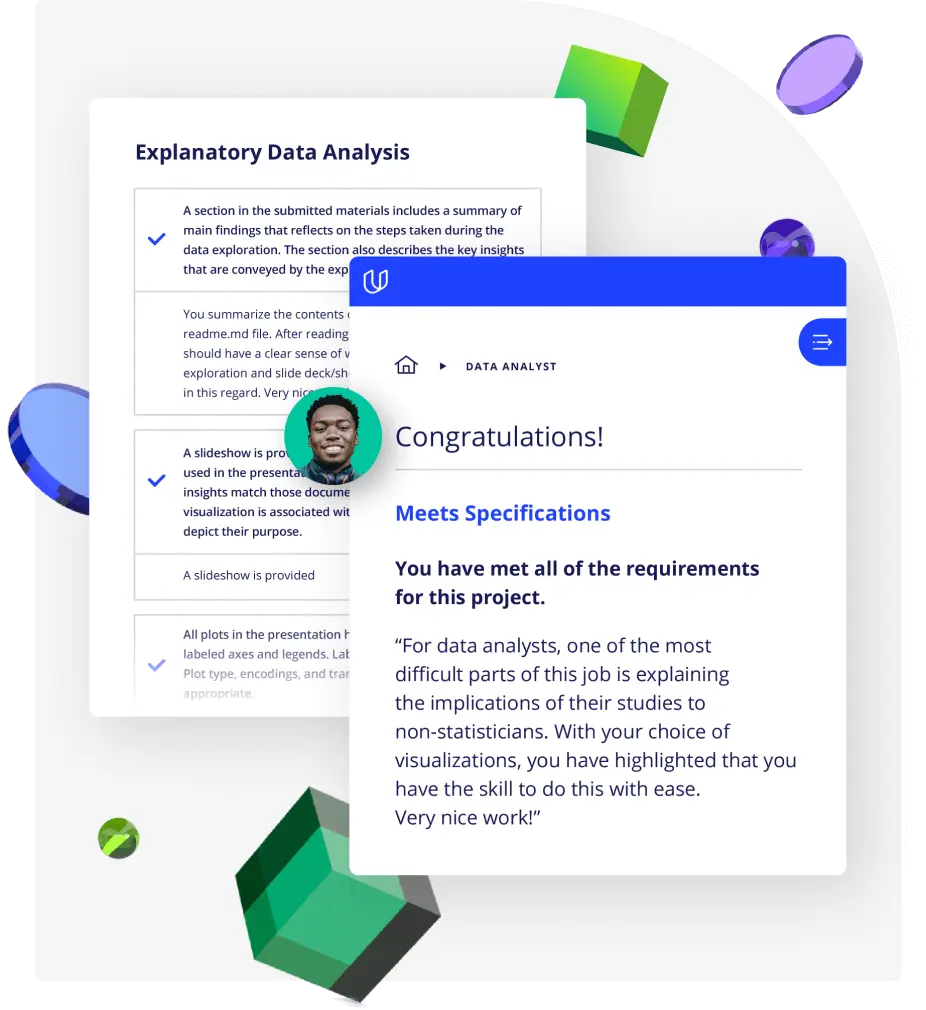
Demonstrate proficiency with practical projects
Projects are based on real-world scenarios and challenges, allowing you to apply the skills you learn to practical situations, while giving you real hands-on experience.
Gain proven experience
Retain knowledge longer
Apply new skills immediately

Top-tier services to ensure learner success
Reviewers provide timely and constructive feedback on your project submissions, highlighting areas of improvement and offering practical tips to enhance your work.
Get help from subject matter experts
Learn industry best practices
Gain valuable insights and improve your skills

Full Catalog Access
One subscription opens up this course and our entire catalog of projects and skills.
Average time to complete a Nanodegree program
(1194)
2 months
, Beginner
3 weeks
, Advanced
3 months
, Beginner
4 weeks
, Beginner
3 months
, Beginner
4 weeks
, Beginner
3 weeks
, Beginner
(272)
2 months
, Intermediate
(47)
2 months
, Beginner
(124)
5 months
, Beginner
(807)
2 months
, Beginner
(88)
3 months
, Beginner
(65)
4 weeks
, Intermediate
4 weeks
, Beginner
(223)
2 months
, Beginner
4 hours
, Beginner

Introduction to Data
(1194)
2 months
, Beginner
3 weeks
, Advanced
3 months
, Beginner
4 weeks
, Beginner
3 months
, Beginner
4 weeks
, Beginner
3 weeks
, Beginner
(272)
2 months
, Intermediate
(47)
2 months
, Beginner
(124)
5 months
, Beginner
(807)
2 months
, Beginner
(88)
3 months
, Beginner
(65)
4 weeks
, Intermediate
4 weeks
, Beginner
(223)
2 months
, Beginner
4 hours
, Beginner