Lesson 1
Welcome!
Welcome to Udacity. Takes 5 minutes to get familiar with Udacity courses and gain some tips to succeed in courses.

Nanodegree Program
Learn what business intelligence analytics is and how enterprises use it. Learners will be introduced to how enterprises can effectively combine different data types and sources to create a sophisticated data model, and what strategies can be used to ensure data accuracy and consistency.
Learn what business intelligence analytics is and how enterprises use it. Learners will be introduced to how enterprises can effectively combine different data types and sources to create a sophisticated data model, and what strategies can be used to ensure data accuracy and consistency.
Beginner
3 months
Real-world Projects
Completion Certificate
Last Updated May 30, 2024
Skills you'll learn:
Prerequisites:
Course 1 • 45 minutes
Welcome to Udacity! We're excited to share more about your Nanodegree program and start this journey with you!
Lesson 1
Welcome to Udacity. Takes 5 minutes to get familiar with Udacity courses and gain some tips to succeed in courses.
Lesson 2
You are starting a challenging but rewarding journey! Take 5 minutes to read how to get help with projects and content.
Course 2 • 4 weeks
This course establishes a framework for data analytics as a series of progressive steps starting with the data source and ending with the interpretation of results. We introduce fundamental concepts such as data analytics life cycle, data integrity, and the four types of data analytics (descriptive, diagnostic, predictive, and prescriptive). Students who complete this course will be equipped with the skills to identify the data analytics strategy used in a given situation and where they are in the data analytics life cycle.
Lesson 1
In this lesson, we will introduce you to data analysis and what we will be covering in this course.
Lesson 2
In this lesson, we will learn how to solve data analysis issues using each step of the data analytics life cycle.
Lesson 3
In this lesson, we will review the importance of data integrity in data analysis, the components of data integrity, and how to identify and fix it.
Lesson 4
In this lesson, we will review each of the different types of data analytics and when to use them, along with statistics that pertain to each analytics type.
Lesson 5
In this lesson, we will introduce Power BI and its capabilities as an analytics and data visualization tool.
Lesson 6 • Project
In this project, you will use what you learned about data analytics to analyze KPIs for a company and represent your analysis with effective visuals.
Lesson 7
In this lesson, you'll learn how to set up a Windows desktop workspace to use Power BI
Course 3 • 4 weeks
The preparation phase is the most important step in data analysis. Before data can be effectively analyzed, an effective data model is required, and creating that data model may utilize a wide range of skills. This course teaches the skills needed to load, clean, and organize data in Power Query and create relational tables in Power Query and Power BI. After completing this course, students will be able to effectively source data in Power BI and create a clean and efficient data model for analysis.
Lesson 1
Introduction to Data Preparation & Modeling lesson introduces students to the topics, highlights, and prerequisites of the course. And requirements to successfully complete the course are explained.
Lesson 2
Relational Data & Table Structure lesson teaches the core concepts around working with data from multiple sources and tables. It explains what relational data is and how it works.
Lesson 3
Power Query & M Overview lesson highlights the Power Query data wrangling system that is used within Power BI. Specific cleaning and organization tools and techniques are explored.
Lesson 4
Data Cleaning & Organization lesson takes a practical deep dive into Power Query. Here more complex data cleaning and organization strategies are practiced, and the M language is explained.
Lesson 5
DAX Language & Quantitative Analysis lesson dives into DAX, which is the primary analytical language of Power BI. Different foundational concepts around DAX calculations are covered.
Lesson 6 • Project
The project asks students to gather data about the US economy to understand better the makeup of the economy and how it’s changing. Students will submit a PowerBI report at the end.
Lesson 7
In this lesson, you'll learn how to set up a Windows desktop workspace to use Power BI
Course 4 • 4 weeks
This course introduces students to a selection of powerful tools in Power BI Desktop that can be used for predictive analysis. Concepts such as classification, regression, and forecasting are discussed in detail, and various techniques are explored with different data sets, allowing students to practice predictive data analysis with a hands-on approach. The content covered in this course can help an enterprise to understand future risk, analyze different markets or make other decisions critical to an organization.
Lesson 1
This lesson will introduce predictive analytics concepts and a general overview of when to use it in your organization. We will also review the project and the primary tool we will use: Power BI.
Lesson 2
We will review one Machine Learning technique that involves numeric data: Regression. We will learn about its main features, how to interpret it and how to construct it using Power BI.
Lesson 3
We will learn additional ML techniques: Classification and Clustering. We will review its main features, some clustering techniques, how to interpret them and how to construct clusters with Power BI.
Lesson 4
We will review what a time-series is. Also, we will review deterministic and probabilistic forecasting methods, how to read and interpret time-series and how to create forecasts using Power BI.
Lesson 5
We will review additional ML and AI-powered tools using Power BI: we will focus on Power BI dataflows and its AutoML features and use two AI-powered visuals: the Q&A and the smart narratives.
Lesson 6 • Project
In this project, students will use the data of past flights departing from the State of New York to analyze and give recommendations about flight delays.
Lesson 7
In this lesson, you'll learn how to set up a Windows desktop workspace to use Power BI

Sr. Analyst, Reporting & Insights
Ivan Vega is a Senior Analyst, Reporting & Insights at T-Mobile. On evenings and weekends, he teaches both SQL and data visualization courses for master's programs at St. Mary's College of California. He has been teaching for over 2 years and has been an analyst for over 8 years.

Senior Business Intelligence Consultant
Joseph works at The Planet Group, engaging with clients in the energy industry across the US. He helps clients collect data, set up data infrastructure, and provide data analysis and forecasting to better understand their operations and finances. He also works as an adjunct instructor of Excel and Microsoft Power BI analytics at the Community College of Rhode Island.

Full Stack Data Analytics Specialist
Daniel has worked for many years in business intelligence and data science and has used Power BI to find unique patterns in data to support decision-making. He is passionate about solving problems through data analytics, and loves the challenge of finding innovative ways to create efficient and impactful data-oriented solutions.
Combine technology training for employees with industry experts, mentors, and projects, for critical thinking that pushes innovation. Our proven upskilling system goes after success—relentlessly.

Demonstrate proficiency with practical projects
Projects are based on real-world scenarios and challenges, allowing you to apply the skills you learn to practical situations, while giving you real hands-on experience.
Gain proven experience
Retain knowledge longer
Apply new skills immediately

Top-tier services to ensure learner success
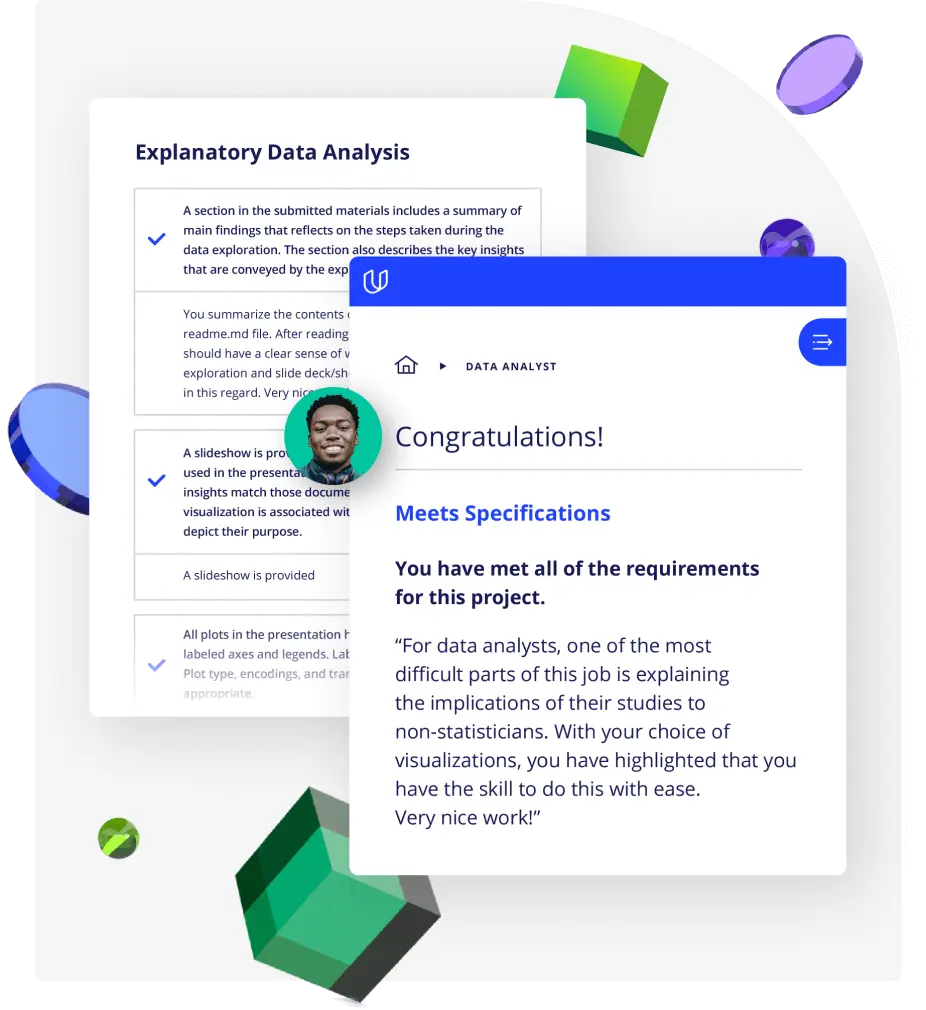
Reviewers provide timely and constructive feedback on your project submissions, highlighting areas of improvement and offering practical tips to enhance your work.
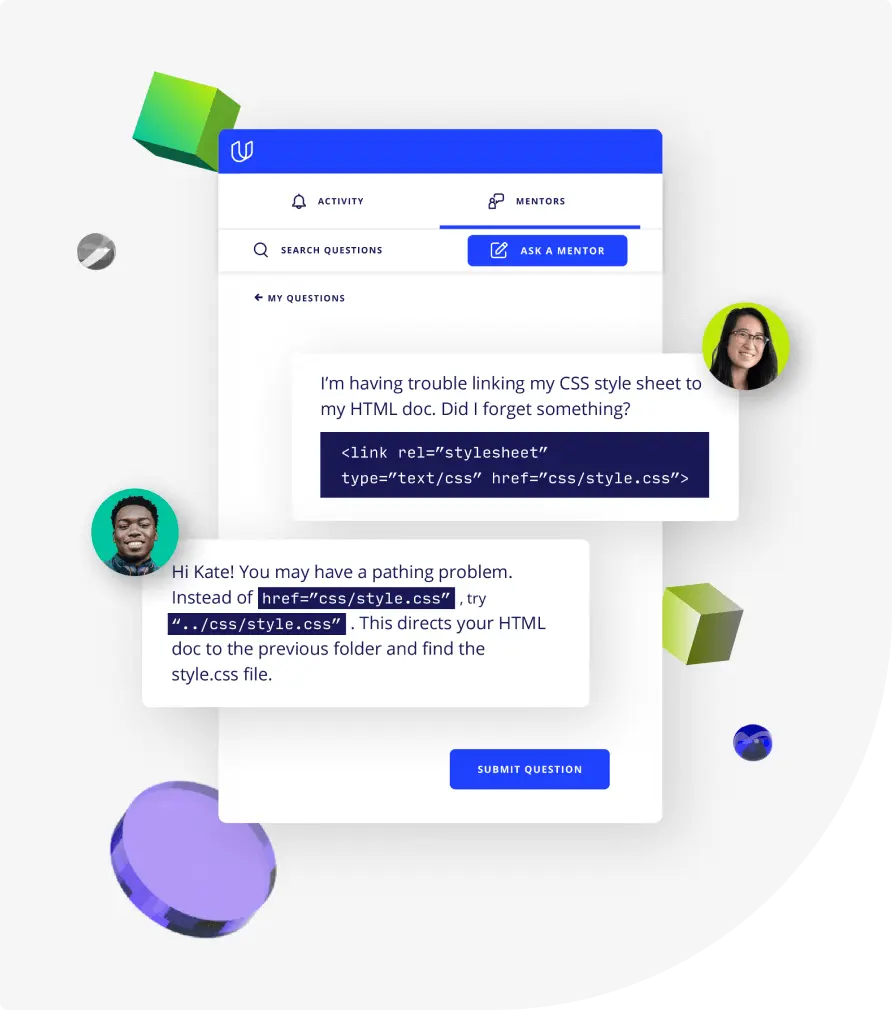
Get help from subject matter experts
Learn industry best practices
Gain valuable insights and improve your skills

Unlimited access to our top-rated courses
Real-world projects
Personalized project reviews
Program certificates
Proven career outcomes
Full Catalog Access
One subscription opens up this course and our entire catalog of projects and skills.
Average time to complete a Nanodegree program
(1194)
2 months
, Beginner
(88)
3 months
, Beginner
3 weeks
, Beginner
(272)
2 months
, Intermediate
4 weeks
, Beginner
4 weeks
, Beginner
3 months
, Beginner
(124)
5 months
, Beginner
4 weeks
, Beginner
3 weeks
, Advanced
4 weeks
, Beginner
3 weeks
, Beginner
(807)
2 months
, Beginner
(265)
2 months
, Beginner
4 weeks
, Beginner
(47)
2 months
, Beginner

Business Intelligence Analytics
(1194)
2 months
, Beginner
(88)
3 months
, Beginner
3 weeks
, Beginner
(272)
2 months
, Intermediate
4 weeks
, Beginner
4 weeks
, Beginner
3 months
, Beginner
(124)
5 months
, Beginner
4 weeks
, Beginner
3 weeks
, Advanced
4 weeks
, Beginner
3 weeks
, Beginner
(807)
2 months
, Beginner
(265)
2 months
, Beginner
4 weeks
, Beginner
(47)
2 months
, Beginner