Lesson 1
Welcome to Data Analysis and Visualization with Power BI
Welcome! We're so glad you're here. Join us in learning a bit more about what to expect and ways to succeed.

Nanodegree Program
This program will equip any learner who wants to develop in-demand skills in data pre-processing, visualization, and analysis using Power BI as the primary tool.
This program will equip any learner who wants to develop in-demand skills in data pre-processing, visualization, and analysis using Power BI as the primary tool.
Beginner
3 months
Real-world Projects
Completion Certificate
Last Updated April 26, 2024
Skills you'll learn:
Prerequisites:
Course 1 • 45 minutes
Welcome to Udacity! We're excited to share more about your nanodegree and start this journey with you! In this course, you will learn more about the pre-requisites, structure of the program, and getting started!
Lesson 1
Welcome! We're so glad you're here. Join us in learning a bit more about what to expect and ways to succeed.
Lesson 2
You are starting a challenging but rewarding journey! Take 5 minutes to read how to get help with projects and content.
Course 2 • 4 weeks
This course is a crucial step in Power BI for anyone who needs to mash together multiple data sources, clean them, restructure them, and harmonize them into a single and efficient data model to support reporting. We’ll cover Power BI’s built-in Extract-Transform-Load (ETL) tool, Power Query, learn foundational data modeling principles, cover some introductory DAX (Data Analytics Expressions), and touch on troubleshooting and optimization.
Lesson 1
Meet your instructor, get an overview of the course, and learn some fundamental concepts about how Power BI is used to prepare data and generate easy-to-understand visual reports.
Lesson 2
Learn core concepts of data modeling in Power BI, including how to make your data model more efficient by splitting it into fact tables and dimension tables.
Lesson 3
Learn how to gather your data using the Get Data feature and tidy it up using basic transformations, so that it is ready for more advance transformations and data modeling.
Lesson 4
Learn different ways we can take the data we have at our fingertips and use bigger transformations to morph it into what we need for our data model and, ultimately, our reporting.
Lesson 5
This lesson is all about relationships and filters. We'll cover relationship cardinality and direction, filter direction, implicit DAX, quick measure, and custom DAX functions that rely on filters.
Lesson 6
Go into greater depth on reports and DAX that is specifically helpful for reporting, including how to add basic components to your report and group the data using measures and calculated columns.
Lesson 7 • Project
Create a data model to help Seven Sages Brewing Company better understand their sales and profitability.
Course 3 • 4 weeks
In this course, students will learn how to carry Power BI beyond mere bar charts and transform their reports into data exploration & storytelling tools that companies can use to better understand their data.
Lesson 1
This lesson will just quickly make sure you've covered everything you need to know and then we'll introduce the topic of data visualization and why it's important.
Lesson 2
In this lesson, we're going to kick things off with an overview of common data visualizations you will use in Power BI such as bar charts, line charts, and advanced visuals like scatter plot and maps.
Lesson 3
In this lesson, we're going to discuss useful design principles that can help those data visuals really shine.
Lesson 4
In this lesson, we'll talk about tools like filters and slicers that will help your users explore data by searching for specific items that interest them.
Lesson 5
In this lesson, we are going to explore a couple of advanced Power BI features that will tie our previous lessons together and test all the skills you have learned up to this point.
Lesson 6 • Project
In this project, you will design and build a Power BI report for Waggle, a start-up company that builds smart devices and apps that help pet owners monitor the health of their pets.
Course 4 • 4 weeks
Using Power BI, the overarching goal of the course is to help students become effective at the process of retrieving, analyzing, and visualizing data in order to answer questions and draw conclusions. After learning about descriptive and inferential statistics, histograms, linear regression, and the concepts of correlation and probability, the course moves into M, the language of Power Query to build custom formulas as part of the data transformation process. Students then learn the language of DAX to analyze data. The final lesson of the course goes through a number of visualizations in Power BI and explores how those visuals may be used, edited, or enhanced to effectively relay information to an audience.
Lesson 1
In this first lesson, we'll introduce data analytics and the need for it. We'll take a brief look a each of the lessons to give students a feel for where we will be spending our time.
Lesson 2
This lesson focuses on the steps of data analysis. We'll also look at specific tools and techniques for analysis including how to construct and interpret histograms and linear regressions.
Lesson 3
In this lesson, we’ll dive deep into Power Query to retrieve and organize data. We'll take an in-depth look at M, the language of Power Query that helps in the data cleanup process.
Lesson 4
This lesson focuses on the DAX language to measure, analyze and understand data, including custom formulas, calculated measures, columns, and tables, and common DAX errors.
Lesson 5
The focus of this lesson will be learning to create or edit advanced visualizations to analyze and present information, with the goal of drawing conclusions.
Lesson 6 • Project
You'll use your analytics skills to create a market analysis report for an online clothing retailer using real-world data to better understand different population groups and industries.

Senior Business Intelligence Consultant
Joseph works at The Planet Group, engaging with clients in the energy industry across the US. He helps clients collect data, set up data infrastructure, and provide data analysis and forecasting to better understand their operations and finances. He also works as an adjunct instructor of Excel and Microsoft Power BI analytics at the Community College of Rhode Island.

Senior Business Intelligence Engineer at Humana
Sean is a Senior Business Intelligence Engineer at Humana, where he oversees an enterprise community of thousands of users & developers. His Power BI work has been featured recently at the Microsoft Business Applications Summit and on Microsoft Mechanics.

Senior Business Intelligence Specialist
Lenore is a Senior Business Intelligence Specialist with a background in finance and a passion for empowering her colleagues to make data-driven decisions—even if the information they have to work with is a little rough around the edges.
Average Rating: 4.6 Stars
88 Reviews
Mustafa E.
February 11, 2023
Great
Fabio Carvalho L.
September 29, 2022
I've been learning a lot so far. There are a few mini-side projects and projects to have enough hands-on experience.
Anonymous
May 15, 2022
The Seven Sages company project was a really good exercise as it covered almost everything we learned so far. Looking forward to learning more visualisations and reporting techniques.
Anonymous
May 13, 2022
Good - the project really tied all the concepts together.
Angelica Maria T.
May 9, 2022
Great
Combine technology training for employees with industry experts, mentors, and projects, for critical thinking that pushes innovation. Our proven upskilling system goes after success—relentlessly.

Demonstrate proficiency with practical projects
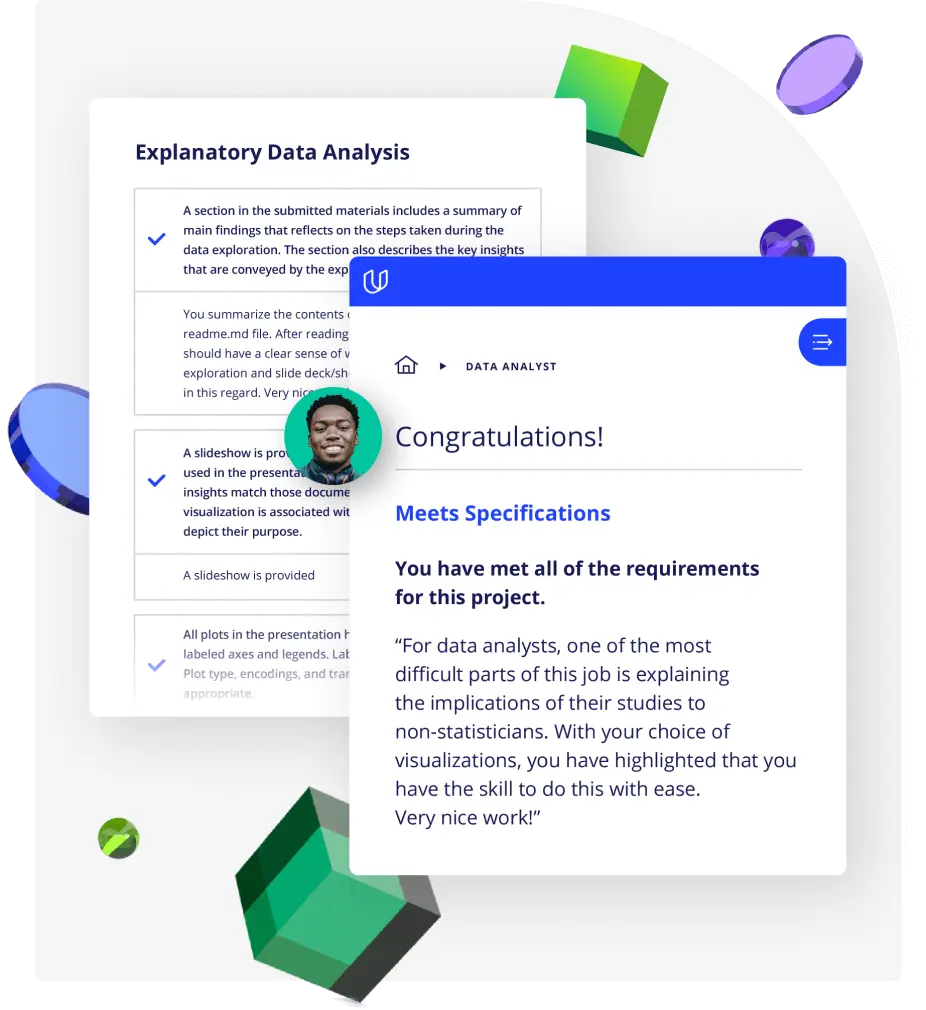
Projects are based on real-world scenarios and challenges, allowing you to apply the skills you learn to practical situations, while giving you real hands-on experience.
Gain proven experience
Retain knowledge longer
Apply new skills immediately

Top-tier services to ensure learner success
Reviewers provide timely and constructive feedback on your project submissions, highlighting areas of improvement and offering practical tips to enhance your work.
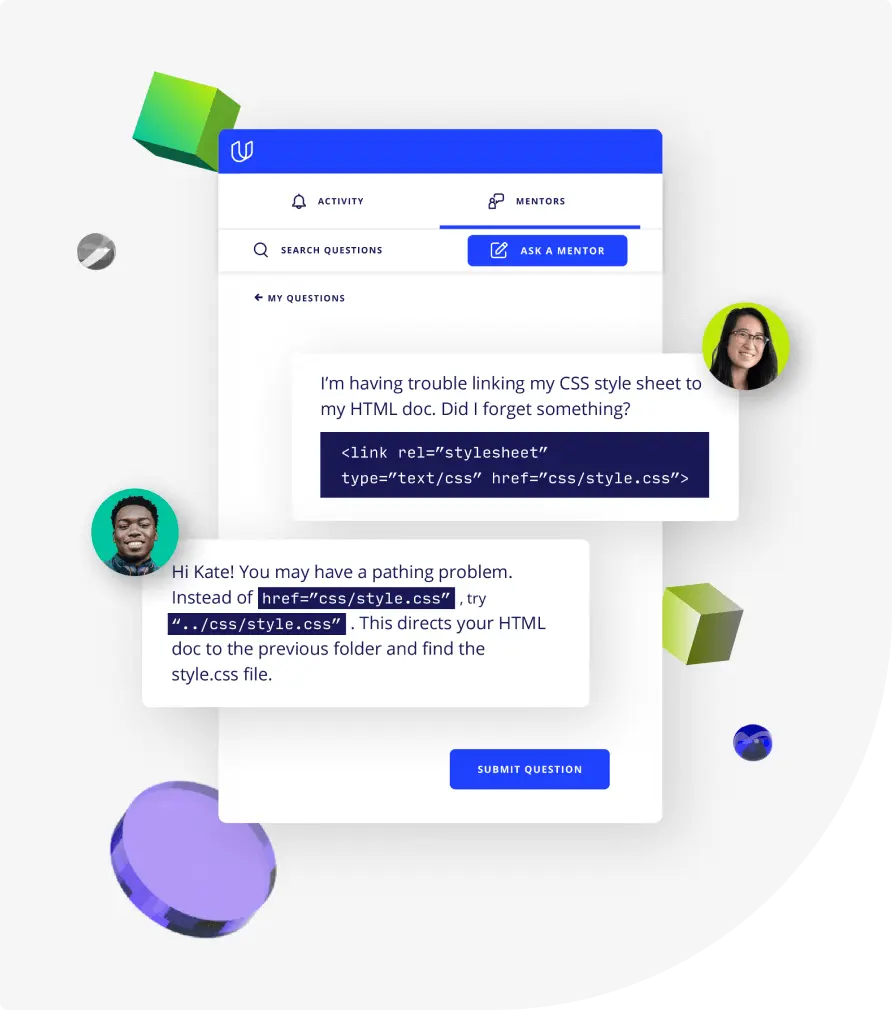
Get help from subject matter experts
Learn industry best practices
Gain valuable insights and improve your skills

Unlimited access to our top-rated courses
Real-world projects
Personalized project reviews
Program certificates
Proven career outcomes
Full Catalog Access
One subscription opens up this course and our entire catalog of projects and skills.
Average time to complete a Nanodegree program
4 weeks
, Beginner
3 months
, Beginner
(124)
5 months
, Beginner
(1194)
2 months
, Beginner
4 weeks
, Beginner
4 weeks
, Beginner
4 weeks
, Beginner
4 weeks
, Beginner
3 weeks
, Beginner
3 months
, Beginner
(47)
2 months
, Beginner
(807)
2 months
, Beginner
(272)
2 months
, Intermediate
4 weeks
, Beginner
3 weeks
, Advanced
(80)
4 months
, Advanced

Data Analysis and Visualization with Microsoft Power BI
4 weeks
, Beginner
3 months
, Beginner
(124)
5 months
, Beginner
(1194)
2 months
, Beginner
4 weeks
, Beginner
4 weeks
, Beginner
4 weeks
, Beginner
4 weeks
, Beginner
3 weeks
, Beginner
3 months
, Beginner
(47)
2 months
, Beginner
(807)
2 months
, Beginner
(272)
2 months
, Intermediate
4 weeks
, Beginner
3 weeks
, Advanced
(80)
4 months
, Advanced