Lesson 1
An Introduction to Your Nanodegree Program
Welcome! We're so glad you're here. Join us in learning a bit more about what to expect and ways to succeed.

Nanodegree Program
Students will learn essential skills, including describing data, understanding probability theory, designing experiments, interpreting statistical results, and applying statistical models with Python. After successfully completing this Nanodegree program, graduates will be armed with a robust foundation in statistical analysis that can be applied to Data Analyst, Business Analyst, and Data Scientist roles.
Students will learn essential skills, including describing data, understanding probability theory, designing experiments, interpreting statistical results, and applying statistical models with Python. After successfully completing this Nanodegree program, graduates will be armed with a robust foundation in statistical analysis that can be applied to Data Analyst, Business Analyst, and Data Scientist roles.
Beginner
3 months
Real-world Projects
Completion Certificate
Last Updated June 14, 2024
Skills you'll learn:
Prerequisites:
Course 1 • 45 minutes
Welcome to Udacity! We're excited to share more about your Nanodegree program and start this journey with you!
Lesson 1
Welcome! We're so glad you're here. Join us in learning a bit more about what to expect and ways to succeed.
Lesson 2
You are starting a challenging but rewarding journey! Take 5 minutes to read how to get help with projects and content.
Course 2 • 5 hours
Learn how to describe data in terms of data types, measures of center, measures of spread, shape, and outliers. These essential skills in descriptive statistics provide the foundation for more advanced statistical techniques that are used for data science, data analysis, and machine learning.
Lesson 1
In this lesson, we kick off the course with an introduction to data and descriptive statistics.
Lesson 2
In this lesson, we establish key distinctions between different types of data, including quantitative, categorical, ordinal, nominal, continuous, and discrete data types.
Lesson 3
In this lesson, we get into the calculations and use cases for three popular measures of center: mean, median, and mode.
Lesson 4
In this lesson, we demystify the mathematical notation used for random variables, observed values, and aggregations.
Lesson 5
In this lesson, we get into the calculations and use cases for several popular measures of spread, including five-number summaries, standard deviation, and variance.
Lesson 6
In this lesson, we cover two additional forms of descriptive statistics for data distributions: shape and outliers.
Course 3 • 10 hours
This course is a comprehensive dive into the fundamental concepts and principles of probability. You’ll begin with basic probability theory, then progress to more complex topics such as binomial distributions, conditional probability, and Bayes’ Rule. These skills will enhance your ability to reason about uncertainty and make claims using data.
Lesson 1
In this lesson, we start off with meeting the instructors and a high-level overview of probability.
Lesson 2
In this lesson, you'll gain the basics of probability using coins and die.
Lesson 3
In this lesson, you'll learn about one of the most popular distributions in probability - the Binomial Distribution.
Lesson 4
Not all events are independent. In this lesson, you'll learn the probability rules for dependent events.
Lesson 5
In this lesson, you'll learn one of the most popular rules in all of statistics - the Bayes Rule.
Course 4 • 15 hours
Experimentation is one of the most important topics in all of statistics because it tells us whether our conclusions are statistically significant. In this course, you will learn about the fundamental role statistics plays in experimentation as well as how to implement statistical concepts in Python.
Lesson 1
In this lesson, we begin the course by meeting the instructors and giving a quick introduction to experimentation.
Lesson 2
In this lesson, you'll learn the mathematics behind moving from a coin flip to a normal distribution.
Lesson 3
In this lesson, you'll learn all about the underpinning of confidence intervals and hypothesis testing - sampling distributions.
Lesson 4
In this lesson, you'll learn how to use sampling distributions and bootstrapping to create a confidence interval for any parameter of interest.
Lesson 5
In this lesson, you'll learn the necessary skills to create and analyze the results of hypothesis testing.
Lesson 6
In this lesson, you'll work through a case study of how A/B testing works in the context of website metrics for an online education company.

Founder and Executive Chairman, Udacity
As the Founder and Chairman of Udacity, Sebastian's mission is to democratize education by providing lifelong learning to millions of students worldwide. He is also the founder of Google X, where he led projects including the Self-Driving Car, Google Glass, and more.

Staff Data Scientist
Josh has been sharing his passion for data for over a decade. He's used data science for work ranging from cancer research to process automation. He recently has found a passion for solving data science problems within marketplace companies.
Combine technology training for employees with industry experts, mentors, and projects, for critical thinking that pushes innovation. Our proven upskilling system goes after success—relentlessly.

Demonstrate proficiency with practical projects
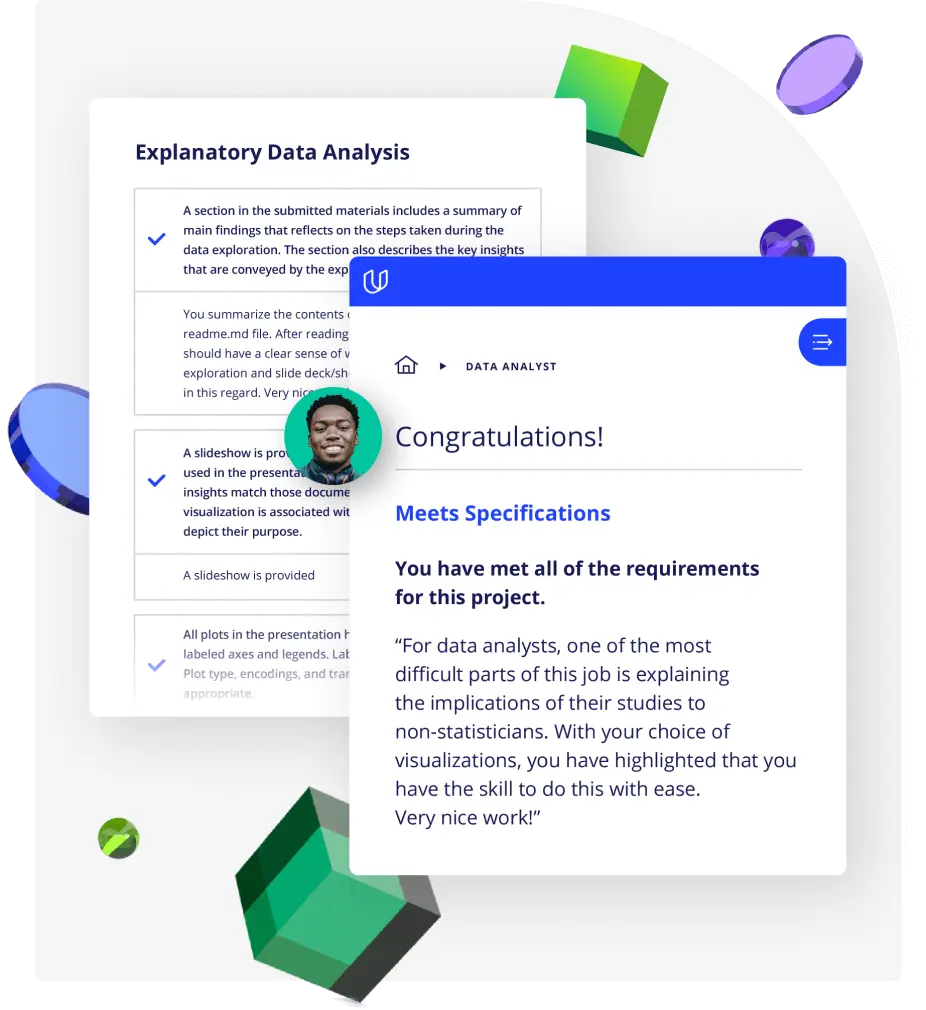
Projects are based on real-world scenarios and challenges, allowing you to apply the skills you learn to practical situations, while giving you real hands-on experience.
Gain proven experience
Retain knowledge longer
Apply new skills immediately

Top-tier services to ensure learner success
Reviewers provide timely and constructive feedback on your project submissions, highlighting areas of improvement and offering practical tips to enhance your work.
Get help from subject matter experts
Learn industry best practices
Gain valuable insights and improve your skills

Full Catalog Access
One subscription opens up this course and our entire catalog of projects and skills.
Average time to complete a Nanodegree program
(807)
2 months
, Beginner
(47)
2 months
, Beginner
4 weeks
, Beginner
3 weeks
, Beginner
3 weeks
, Advanced
(1194)
2 months
, Beginner
(124)
5 months
, Beginner
4 weeks
, Beginner
3 months
, Beginner
(781)
4 months
, Advanced
(88)
3 months
, Beginner
20 hours
, Intermediate
3 weeks
, Beginner
3 weeks
, Intermediate
1 hour
, Discovery
(272)
2 months
, Intermediate

Statistics for Data Analysis
(807)
2 months
, Beginner
(47)
2 months
, Beginner
4 weeks
, Beginner
3 weeks
, Beginner
3 weeks
, Advanced
(1194)
2 months
, Beginner
(124)
5 months
, Beginner
4 weeks
, Beginner
3 months
, Beginner
(781)
4 months
, Advanced
(88)
3 months
, Beginner
20 hours
, Intermediate
3 weeks
, Beginner
3 weeks
, Intermediate
1 hour
, Discovery
(272)
2 months
, Intermediate