Last Updated on October 23, 2024
This post was last updated on July 8, 2021.
You’ve heard a picture is worth a thousand words, but once you’ve seen data visualization done right, you’ll know it’s worth at least a million.
The increasingly popular medium of data visualization is one of the most impactful ways data analysts and data scientists have to communicate their findings. Creators are making entire websites, podcasts, and Twitter feeds devoted entirely to sharing rich, immersive data-driven experiences, and audiences can’t seem to get enough.
As inspiration for your own work with data, check out these 15 data visualizations that will blow your mind. Taken together, this roundup is an at-a-glance representation of the range of uses data analysis has, from pop culture to public good.
As Erik Berger, a senior web technology manager who’s been working in data analysis for 16 years, puts it, “There are more public sources to find data than ever before. Everything from voting patterns to weather data is available to be interpreted. With the rise of social media, you can even do things like compare the mood of Twitter to the stock market to make predictions. Even professional sports teams are hiring data analysts to help win.”
The best data visualizations are storytelling tools that spark discussion and elicit calls to action. Check out these examples.
1. COVID-19 Heat Map
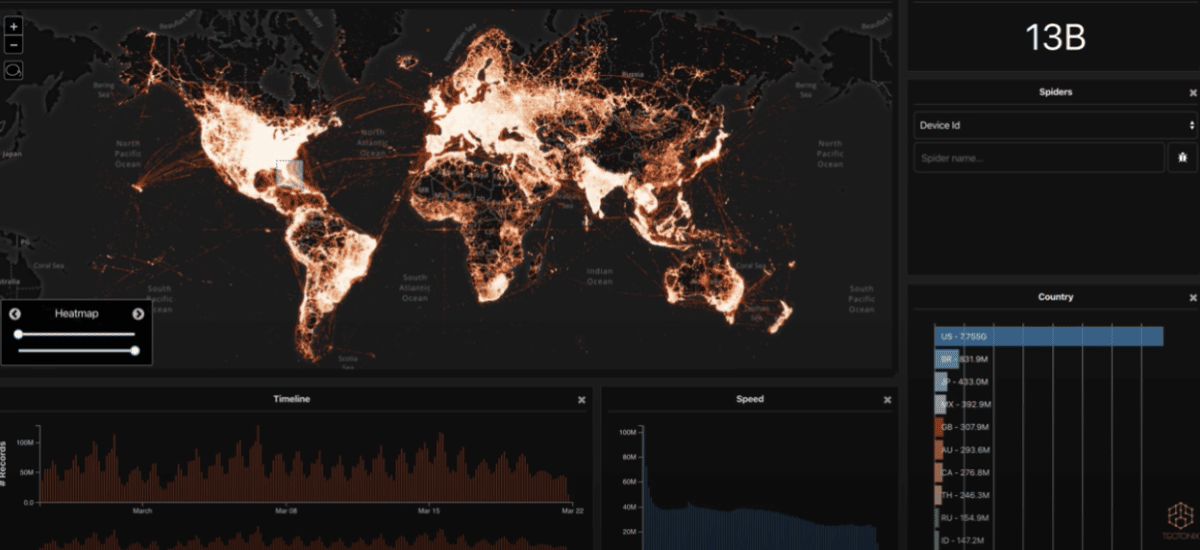
Image: YouTube/Tectronix
We couldn’t update this list for 2021 without the biggest news item of the past year, COVID-19. Back in March 2020, data visualization software provider Tectronix began using location-specific data mapping to track movements of anonymized smartphone data collected in Florida during spring break for the purpose of tracing potential chains of viral infection. You can view the full visualization, Spring Break vs. COVID-19: The Real Impact of Ignoring Social Distancing on Tectronix’s YouTube channel.
Other examples of pandemic-related data visualization include those created by The Center for Systems Science and Engineering (CSSE) at Johns Hopkins University, the Centers for Disease Control (CDC) and the COVID-19 Data Hub at analytics platform Tableau.
2. Quarantine and Social Isolation
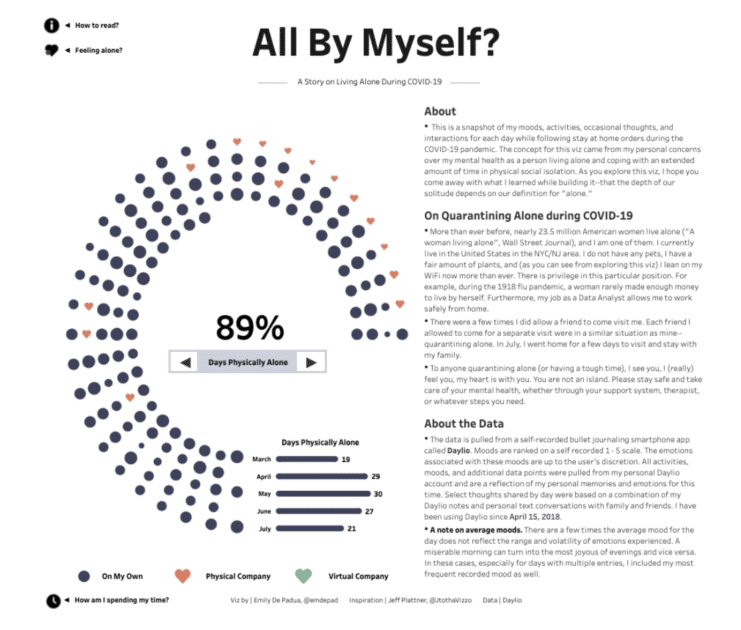
Image: Tableau
COVID-19 had far reaching impacts, beyond the virus itself, that people interested in data have been tracking and analyzing. We all experienced the effects of quarantine, social isolation, and social distancing.
Data analyst, Emily de Padua, created a visualization, All By Myself — a snapshot of her moods, thoughts, activities, and interactions while quarantining alone while adhering to stay at home orders, as well as resources for support. She characterized the project as, “a visual love letter for any one quarantining alone & to the people that love us.”
3. Charles Minard’s Visualization of Napoleon’s 1812 March
 Image via Edward Tufte
This classic lithograph dates back to 1869, displaying the number of men in Napoleon’s 1812 Russian army, their movements, and the temperatures they encountered along their way. It’s been called one of the “best statistical drawings ever created.” The work is an important reminder that the fundamentals of data visualization lie in a nuanced understanding of the many dimensions of data. Tools like D3.js and HTML are no good without a firm grasp of your dataset and sharp communication skills.
4. Hans Rosling’s 200 Countries, 200 Years, 4 Minutes
 Image: YouTube/BBC
Global health data expert Hans Rosling’s famous statistical documentary The Joy of Stats aired on BBC in 2010, but it’s still turning heads. One segment in particular is pretty mind-blowing. In “200 Countries, 200 Years, 4 Minutes,” Rosling uses augmented reality to explore public health data in 200 countries over 200 years using 120,000 numbers, in just four minutes. His work plots life expectancy against income for every country since 1810, pointing to a closing gap between Western and non-Western countries. Check out the full video clip here.
5. Global Pollution
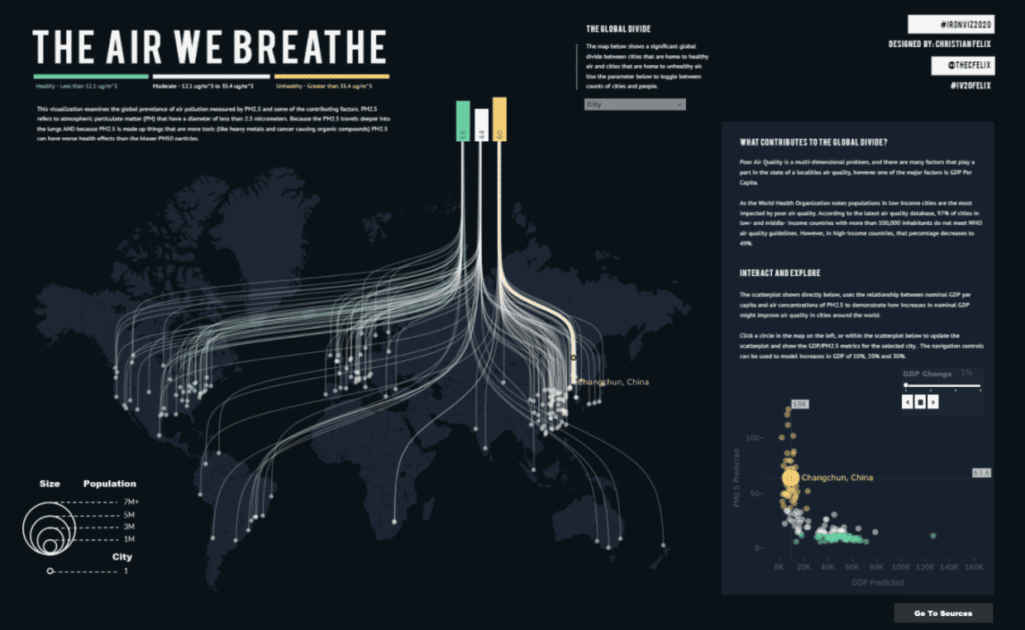 Image: Tableau
Long before an airborne virus captured our attention, scientists and environmental activists have been warning us about the air we breathe. The Air We Breathe is a data visualization that examines the global prevalence of air pollution, contributing factors, and the dangerous toxins that travel into our lungs.
6. 100 Years of Rock Music
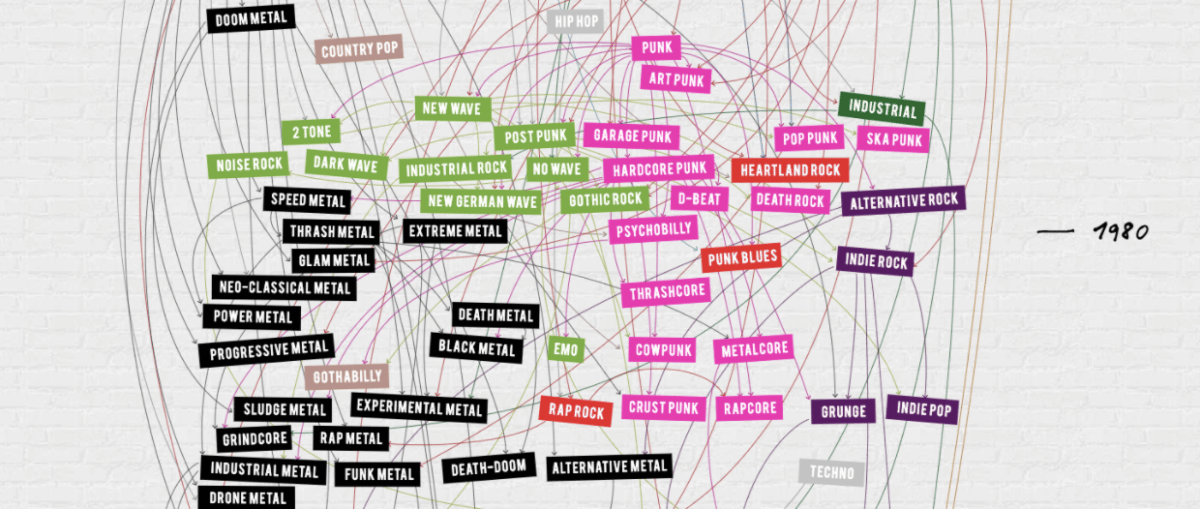 Image: ConcertHotels.com
On a more upbeat note, ConcertHotels.com created a data visualization to show the progression or rock music over time — complete with influence links and audio samples of each genre.
Not only does it offer a fun and interesting glimpse into one of the world’s most popular forms of entertainment, it also illustrates how data visualization can effectively summarize, simplify, and present a ton of information in an appealing way.
7. Data Breaches
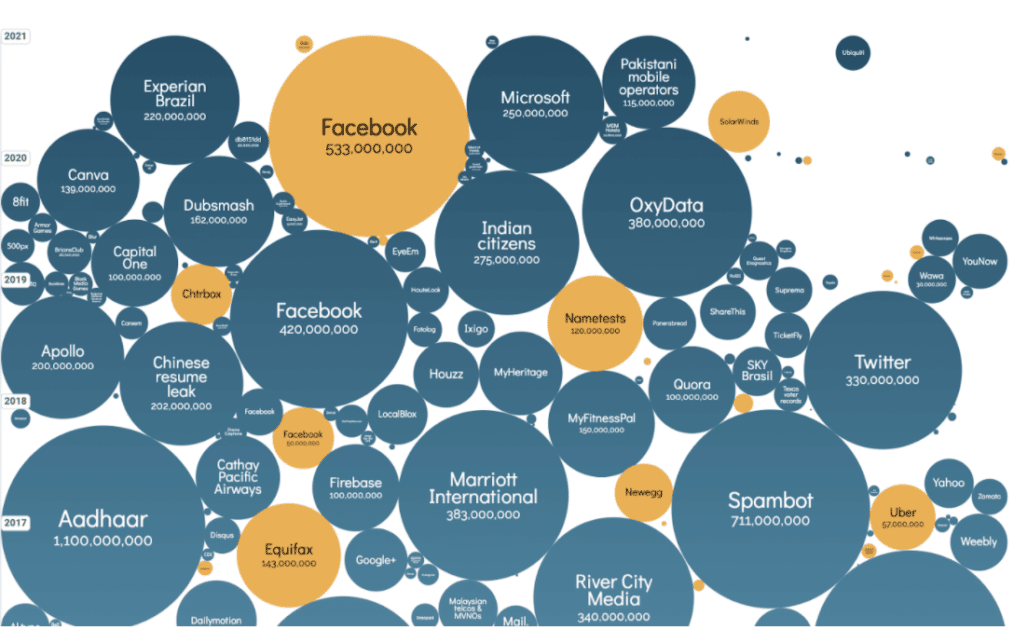 Image: information is beautiful
If it seems like you’re hearing about more and more data breaches every day, this regularly updated data visualization will show you that it isn’t your imagination.
At a glance, The World’s Biggest Data Breaches by Information is Beautiful shows how threats to data have increased over time as well as the biggest breaches.
8. U.S. 2020 Election Map
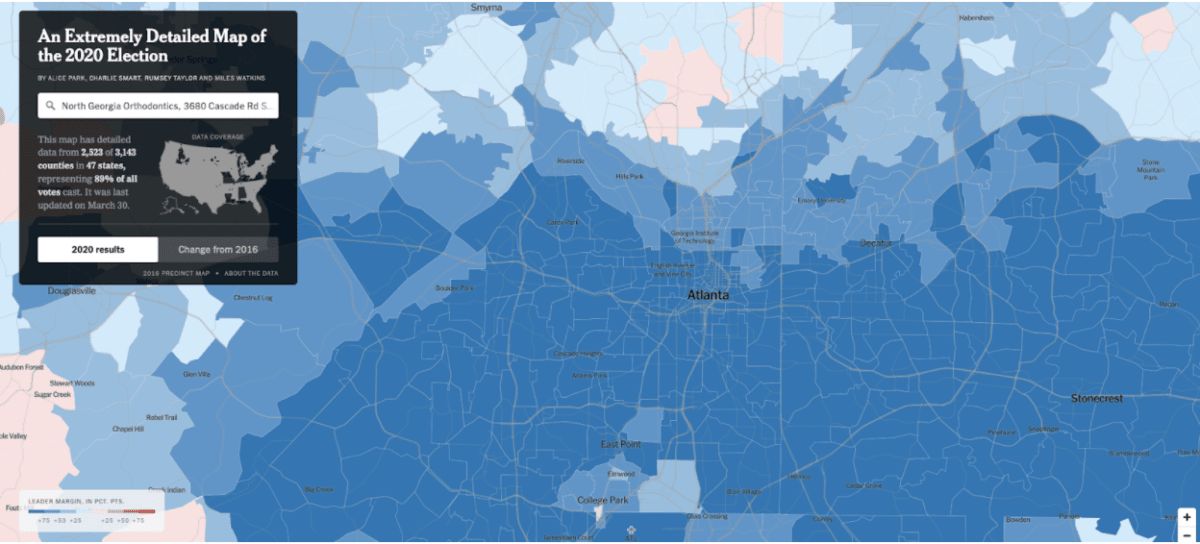 Image: The New York Times
The whole world was watching the U.S. Presidential election of 2020, and data visualizations teams were busy making sure everyone could see exactly what was happening in every locale around the country.
The result? An Extremely Detailed Map of the 2020 Election from The New York Times that includes 89% of all votes cast in 2,523 counties, with interactive search features.
9. Getting Unstuck in the Suez Canal
 Image: The Washington Post
When a massive ship, the Ever Given, got stuck in the Suez Canal in March 2021, the whole world needed it to get unstuck. Not only were the 200+ tons and 20,000+ shipping containers onboard the ship stuck, so were the ships behind it, holding up a reported $9.6 billion dollars worth of goods.
It took an immense coordinated effort to free the ship, which is captured in this visual analysis timeline created by the Washington Post.
10. Major Changes ahead for the United States Postal Service?
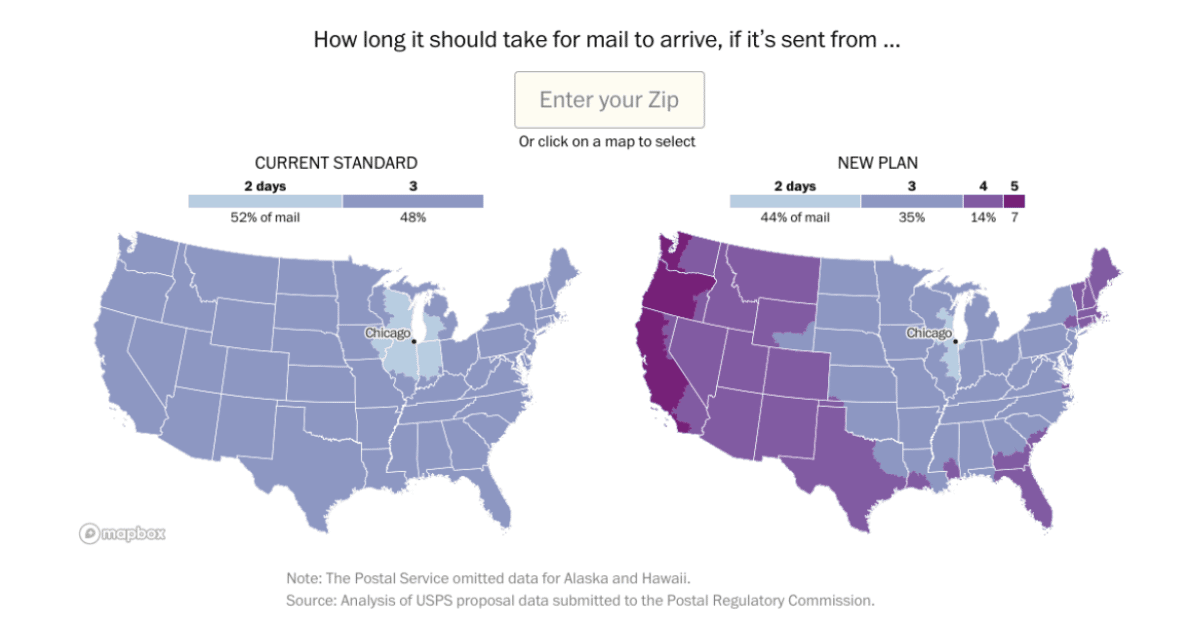 Image: The Washington Post
In recent years, the United States Postal Service (USPS) has been under scrutiny and they’re facing a projected $160 billion deficit over the next decade. One proposed solution is to alter service in some locales.
To help the public understand what’s happening and how the proposed changes will affect them, the Washington Post included an interactive data visualization aid with their story, DeJoy’s USPS slowdown plan will delay the mail. What’s it mean for your Zip code?
11. The Human Development Index
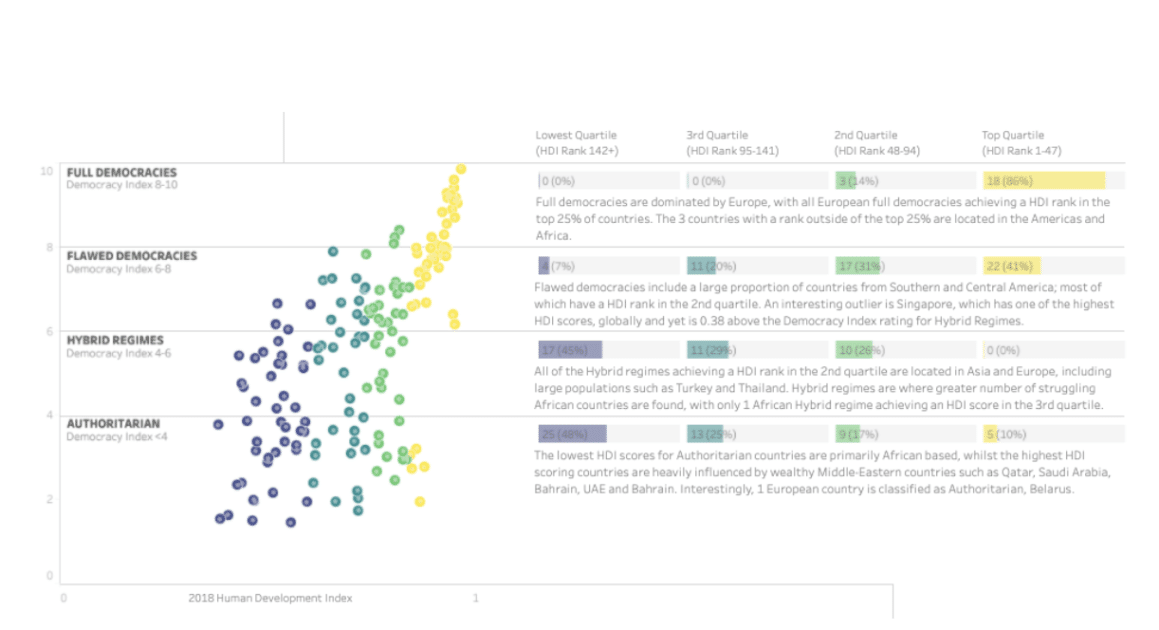 Image: Tableau
The Human Development Index (HDI) is a method used by the United Nations to assess the achievement in three basic dimensions of human development—life expectancy, education, and income. This robust interactive data visualizations project explores how the HDI has changed in the 21st century, how it differs by geographical region, the influence of democracy and conflict on HDI, and what drives HDI.
12. Falling Birthrates
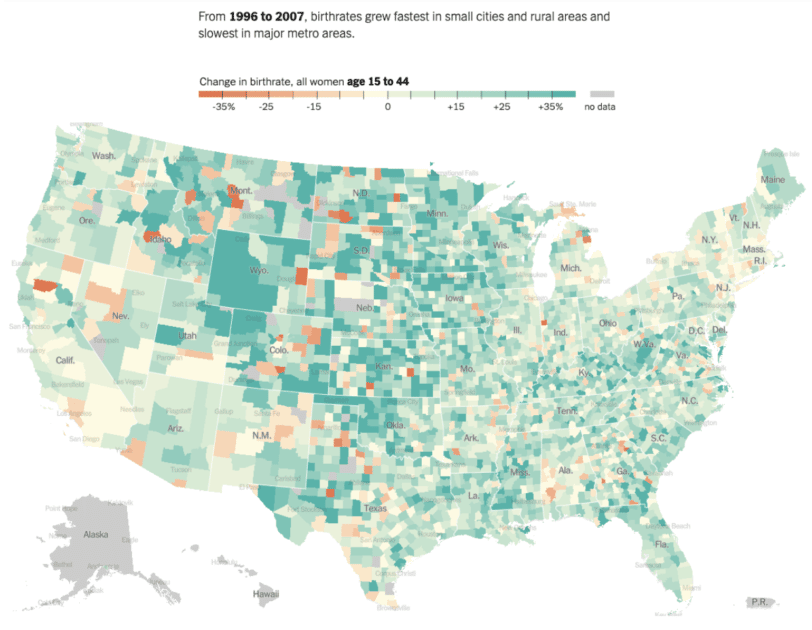 Image: The New York Times
With declining birth rates in developed nations around the world, researchers are warning that the baby bust is here. This story in The New York Times examines a wide range of reasons American women are delaying motherhood, and includes data-driven geographic data visualizations.
13. Renting vs. Buying
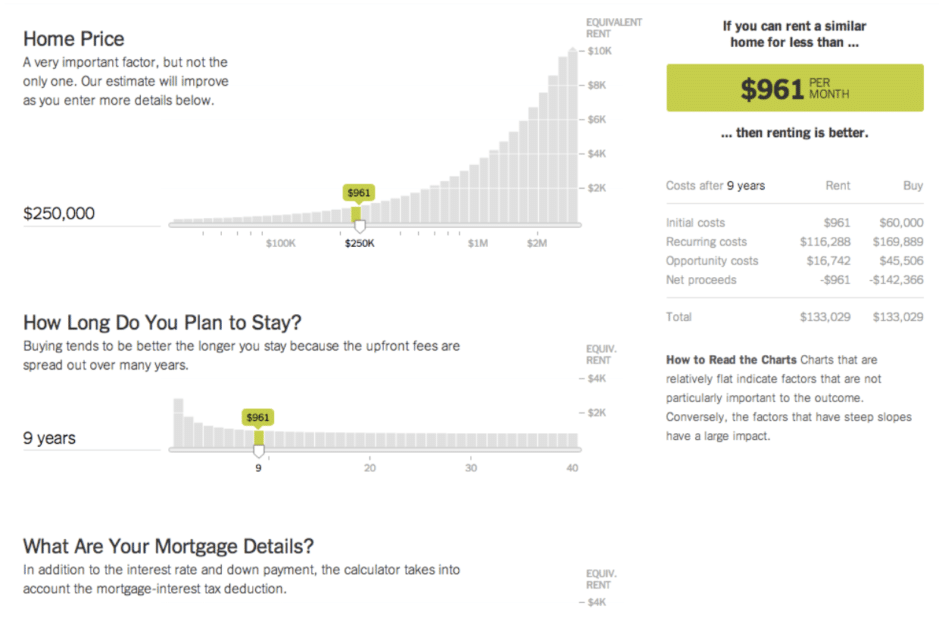 Image: NYTimes
As millennials are having a tougher time affording homes and choosing different options, this question continues to be top of mind for many. Mike Bostock, New York Times graphics department editor and inventor of D3.js, built a complex interactive data calculator that offers a cost/benefit analysis for prospective homebuyers.
14. How the Ultrarich Avoid Taxes
 Image: ProPublica
No matter how you feel about billionaires, anyone interested in data is sure to find this interactive visualization from ProPublica on how the ultrarich are able to utilize retirement accounts as a tax-free way to grow their wealth thought provoking.
15. Global Carbon Emissions
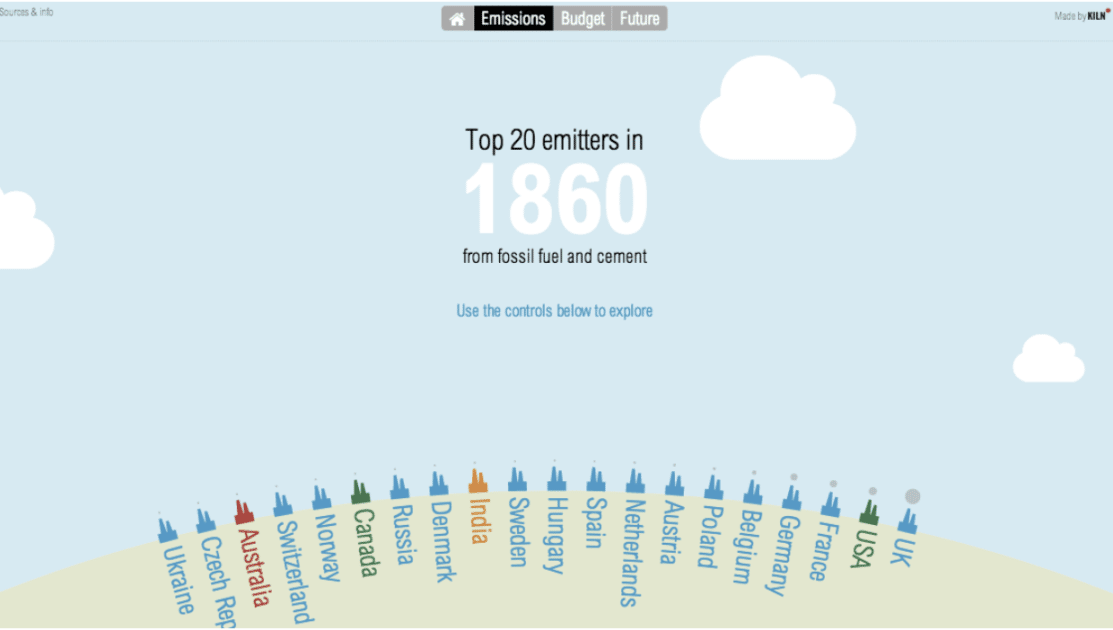 Image: The Guardian
This data visualization, based on data from the World Resource Institute’s Climate Analysis Indicators Tool and the Intergovernmental Panel on Climate Change, shows how national CO₂ emissions have transformed over the last 150 years and what the future might hold. Explore emissions by country for a range of different scenarios.
Learn How to Translate Your Data into Compelling Visuals
Knowledge is power, but in order to make your knowledge of data actually powerful, you have to be able to display your findings in a coherent, compelling way. That’s where data visualization comes into play. With more data available than ever before, opportunities are both rich and plentiful for you to explore how to convey ideas behind data effectively.
Interested in getting started? Check out the Data Visualization Nanodegree program.