Lesson 1
Introduction to the Advanced Data Analytics Course
In this first lesson, we'll introduce data analytics and the need for it. We'll take a brief look a each of the lessons to give students a feel for where we will be spending our time.

Course
Using Power BI, the overarching goal of the course is to help students become effective at the process of retrieving, analyzing, and visualizing data in order to answer questions and draw conclusions. After learning about descriptive and inferential statistics, histograms, linear regression, and the concepts of correlation and probability, the course moves into M, the language of Power Query to build custom formulas as part of the data transformation process. Students then learn the language of DAX to analyze data. The final lesson of the course goes through a number of visualizations in Power BI and explores how those visuals may be used, edited, or enhanced to effectively relay information to an audience.
Using Power BI, the overarching goal of the course is to help students become effective at the process of retrieving, analyzing, and visualizing data in order to answer questions and draw conclusions. After learning about descriptive and inferential statistics, histograms, linear regression, and the concepts of correlation and probability, the course moves into M, the language of Power Query to build custom formulas as part of the data transformation process. Students then learn the language of DAX to analyze data. The final lesson of the course goes through a number of visualizations in Power BI and explores how those visuals may be used, edited, or enhanced to effectively relay information to an audience.
Beginner
4 weeks
Real-world Projects
Completion Certificate
Last Updated March 7, 2024
Skills you'll learn:
Prerequisites:
Lesson 1
In this first lesson, we'll introduce data analytics and the need for it. We'll take a brief look a each of the lessons to give students a feel for where we will be spending our time.
Lesson 2
This lesson focuses on the steps of data analysis. We'll also look at specific tools and techniques for analysis including how to construct and interpret histograms and linear regressions.
Lesson 3
In this lesson, we’ll dive deep into Power Query to retrieve and organize data. We'll take an in-depth look at M, the language of Power Query that helps in the data cleanup process.
Lesson 4
This lesson focuses on the DAX language to measure, analyze and understand data, including custom formulas, calculated measures, columns, and tables, and common DAX errors.
Lesson 5
The focus of this lesson will be learning to create or edit advanced visualizations to analyze and present information, with the goal of drawing conclusions.
Lesson 6 • Project
You'll use your analytics skills to create a market analysis report for an online clothing retailer using real-world data to better understand different population groups and industries.

Senior Business Intelligence Consultant
Joseph works at The Planet Group, engaging with clients in the energy industry across the US. He helps clients collect data, set up data infrastructure, and provide data analysis and forecasting to better understand their operations and finances. He also works as an adjunct instructor of Excel and Microsoft Power BI analytics at the Community College of Rhode Island.
Combine technology training for employees with industry experts, mentors, and projects, for critical thinking that pushes innovation. Our proven upskilling system goes after success—relentlessly.

Demonstrate proficiency with practical projects
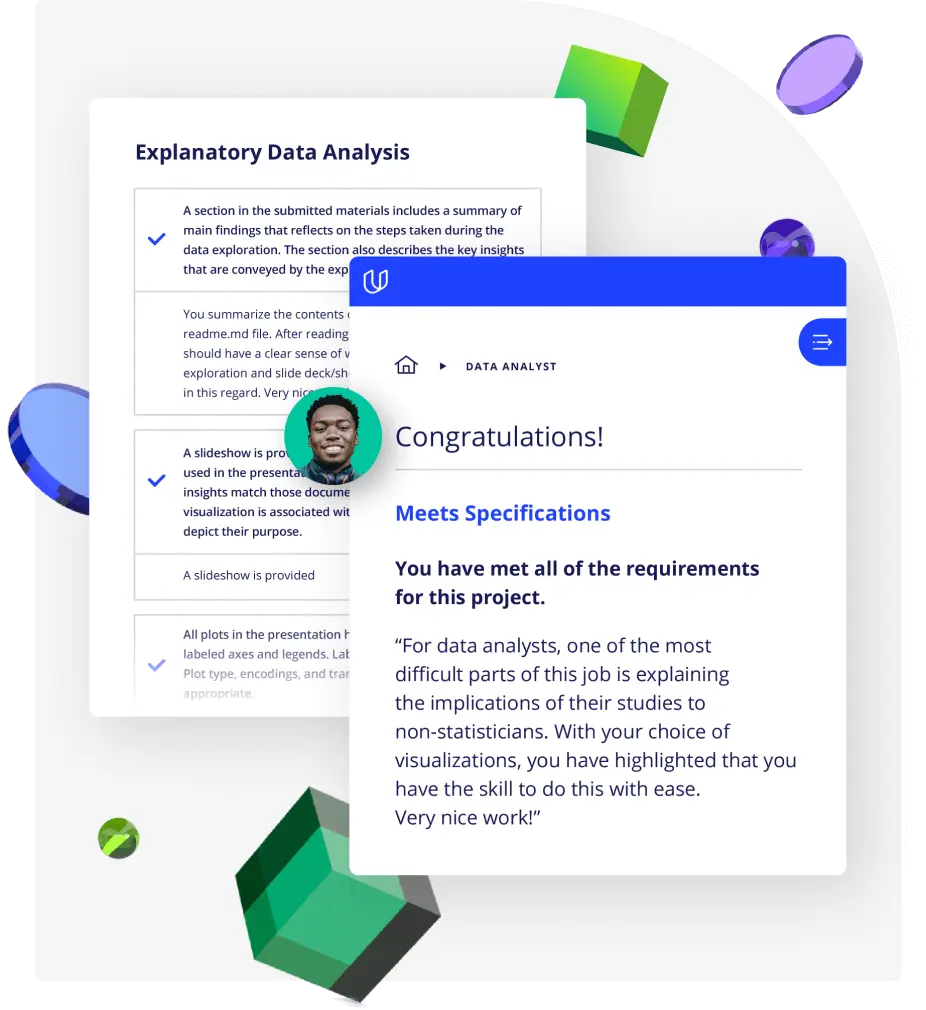
Projects are based on real-world scenarios and challenges, allowing you to apply the skills you learn to practical situations, while giving you real hands-on experience.
Gain proven experience
Retain knowledge longer
Apply new skills immediately

Top-tier services to ensure learner success
Reviewers provide timely and constructive feedback on your project submissions, highlighting areas of improvement and offering practical tips to enhance your work.
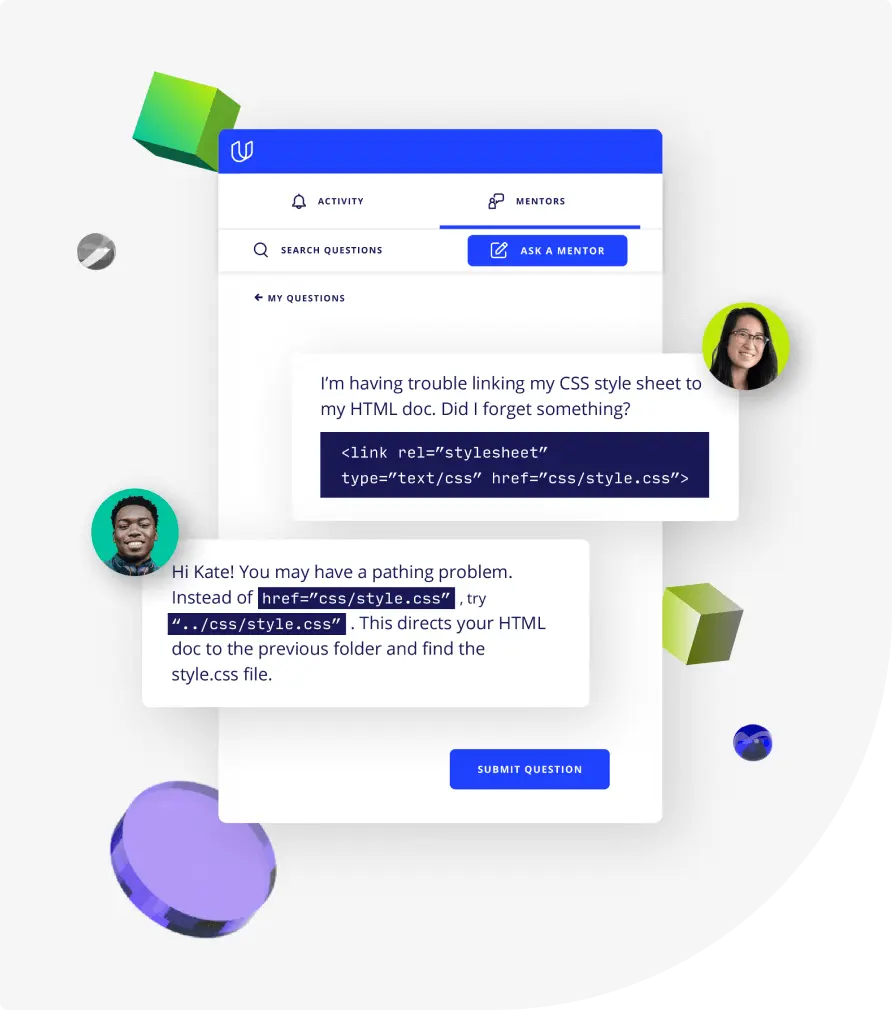
Get help from subject matter experts
Learn industry best practices
Gain valuable insights and improve your skills

Unlimited access to our top-rated courses
Real-world projects
Personalized project reviews
Program certificates
Proven career outcomes
Full Catalog Access
One subscription opens up this course and our entire catalog of projects and skills.
Average time to complete a Nanodegree program
4 weeks
, Beginner
(88)
3 months
, Beginner
4 weeks
, Beginner
4 weeks
, Beginner
4 weeks
, Beginner
4 weeks
, Beginner
3 months
, Beginner
3 weeks
, Beginner
(1194)
2 months
, Beginner
3 weeks
, Advanced
(124)
5 months
, Beginner
3 months
, Beginner
4 weeks
, Intermediate
3 weeks
, Beginner
4 weeks
, Beginner
4 weeks
, Intermediate

Advanced Data Analysis with Power BI
4 weeks
, Beginner
(88)
3 months
, Beginner
4 weeks
, Beginner
4 weeks
, Beginner
4 weeks
, Beginner
4 weeks
, Beginner
3 months
, Beginner
3 weeks
, Beginner
(1194)
2 months
, Beginner
3 weeks
, Advanced
(124)
5 months
, Beginner
3 months
, Beginner
4 weeks
, Intermediate
3 weeks
, Beginner
4 weeks
, Beginner
4 weeks
, Intermediate