Lesson 1
Data Visualization Fundamentals
In this lesson you learn to evaluate the quality of data visualizations and build high quality visualizations, starting with the fundamentals of data dashboards.

Course
Learn how to select the most appropriate data visualization for an analysis. Learn how to evaluate the effectiveness of a data visualization and build interactive and engaging Tableau dashboards.
Learn how to select the most appropriate data visualization for an analysis. Learn how to evaluate the effectiveness of a data visualization and build interactive and engaging Tableau dashboards.
Beginner
1 week
Real-world Projects
Completion Certificate
Last Updated February 22, 2024
Skills you'll learn:
Prerequisites:
Lesson 1
In this lesson you learn to evaluate the quality of data visualizations and build high quality visualizations, starting with the fundamentals of data dashboards.
Lesson 2
In this lesson you learn to implement the best design practices, and to use the most appropriate chart for a particular situation.
Lesson 3
This lesson teaches you how to build data visualizations in Tableau using data hierarchies, filters, groups, sets, and calculated fields, as well as create map-based data visualizations in Tableau.
Lesson 4
In this lesson you learn how to build interactive Tableau dashboards and tell impactful stories using data.
Lesson 5 • Project
In this project, you’ll build interactive dashboards with Tableau and use them to discover and communicate insights from data.

Content Developer
Mat is a former physicist, research neuroscientist, and data scientist. He did his PhD and Postdoctoral Fellowship at the University of California, Berkeley.
Combine technology training for employees with industry experts, mentors, and projects, for critical thinking that pushes innovation. Our proven upskilling system goes after success—relentlessly.

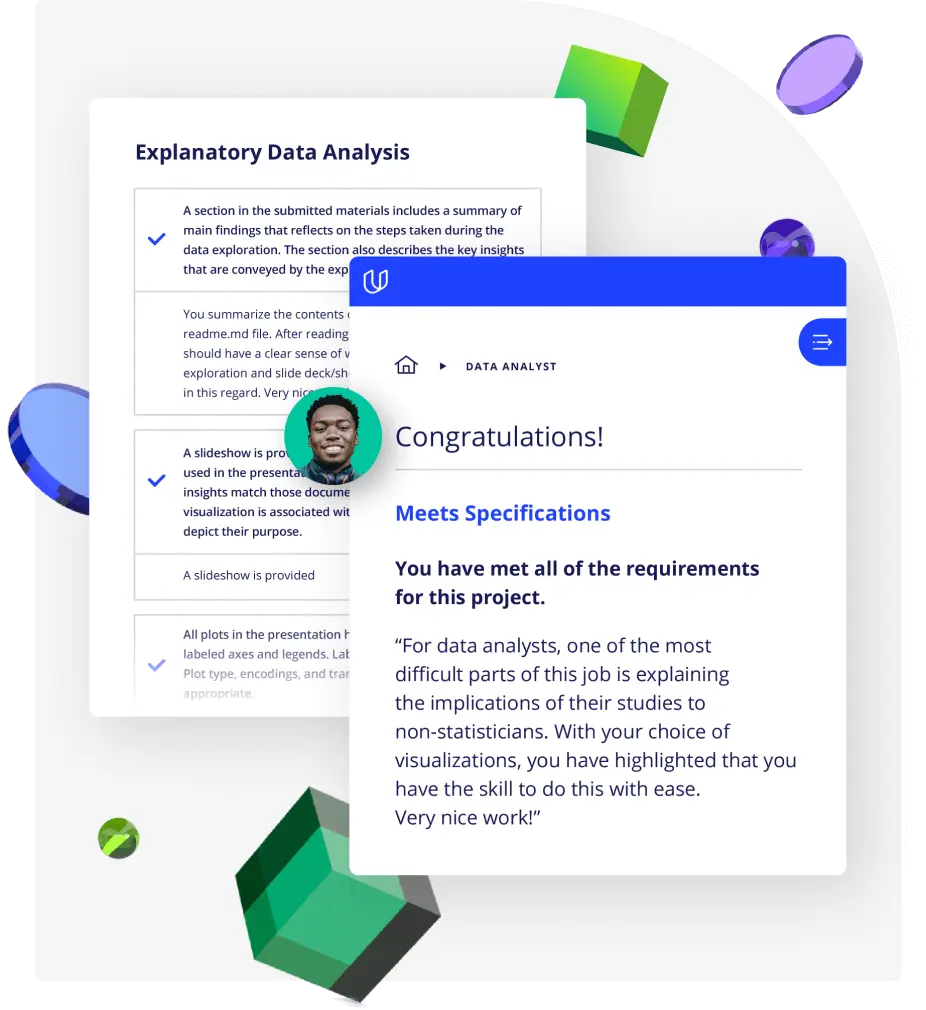
Demonstrate proficiency with practical projects
Projects are based on real-world scenarios and challenges, allowing you to apply the skills you learn to practical situations, while giving you real hands-on experience.
Gain proven experience
Retain knowledge longer
Apply new skills immediately

Top-tier services to ensure learner success
Reviewers provide timely and constructive feedback on your project submissions, highlighting areas of improvement and offering practical tips to enhance your work.
Get help from subject matter experts
Learn industry best practices
Gain valuable insights and improve your skills

Unlimited access to our top-rated courses
Real-world projects
Personalized project reviews
Program certificates
Proven career outcomes
Full Catalog Access
One subscription opens up this course and our entire catalog of projects and skills.
Average time to complete a Nanodegree program
4 weeks
, Beginner
2 months
, Beginner
(124)
5 months
, Beginner
1 hour
, Discovery
4 weeks
, Beginner
4 weeks
, Intermediate
3 weeks
, Beginner
4 weeks
, Beginner
3 weeks
, Advanced
1 hour
, Discovery
4 weeks
, Beginner
4 hours
, Beginner
1 month
, Beginner
(88)
3 months
, Beginner
(1194)
2 months
, Beginner

Data Visualization in Tableau
4 weeks
, Beginner
2 months
, Beginner
(124)
5 months
, Beginner
1 hour
, Discovery
4 weeks
, Beginner
4 weeks
, Intermediate
3 weeks
, Beginner
4 weeks
, Beginner
3 weeks
, Advanced
1 hour
, Discovery
4 weeks
, Beginner
4 hours
, Beginner
1 month
, Beginner
(88)
3 months
, Beginner
(1194)
2 months
, Beginner