Lesson 1
Data Visualization in Data Analysis
In this lesson, see the motivations for why data visualization is an important part of the data analysis process and where it fits in.

Course
Learn to apply sound design and data visualization principles to the data analysis process. Learn how to use analysis and visualizations to tell a story with data.
Learn to apply sound design and data visualization principles to the data analysis process. Learn how to use analysis and visualizations to tell a story with data.
Intermediate
4 weeks
Real-world Projects
Completion Certificate
Last Updated January 31, 2024
Skills you'll learn:
Prerequisites:
Lesson 1
In this lesson, see the motivations for why data visualization is an important part of the data analysis process and where it fits in.
Lesson 2
Learn about elements of visualization design, especially to avoid those elements that can cause a visualization to fail.
Lesson 3
In this lesson, you will see how you can use matplotlib and seaborn to produce informative visualizations of single variables.
Lesson 4
In this lesson, build up from your understanding of individual variables and learn how to use matplotlib and seaborn to look at relationships between two variables.
Lesson 5
In this lesson, see how you can use matplotlib and seaborn to visualize relationships and interactions between three or more variables.
Lesson 6
Previous lessons covered how you could use visualizations to learn about your data. In this lesson, see how to polish up those plots to convey your findings to others!
Lesson 7 • Project
Choose a dataset, either your own or a Udacity-curated dataset, and perform an exploratory data analysis using Python. Then, create a presentation with explanatory plots that conveys your findings.

Senior Data Scientist
Josh is a Senior Data Scientist at Local Logic, where he models commercial real estate trends, acquisitions, and sustainable cities. He was formerly Assistant Professor of Data Analytics at Stonehill College, and was a postdoctoral researcher in nuclear physics at Lawrence Livermore National Laboratory.
Combine technology training for employees with industry experts, mentors, and projects, for critical thinking that pushes innovation. Our proven upskilling system goes after success—relentlessly.

Demonstrate proficiency with practical projects
Projects are based on real-world scenarios and challenges, allowing you to apply the skills you learn to practical situations, while giving you real hands-on experience.
Gain proven experience
Retain knowledge longer
Apply new skills immediately

Top-tier services to ensure learner success
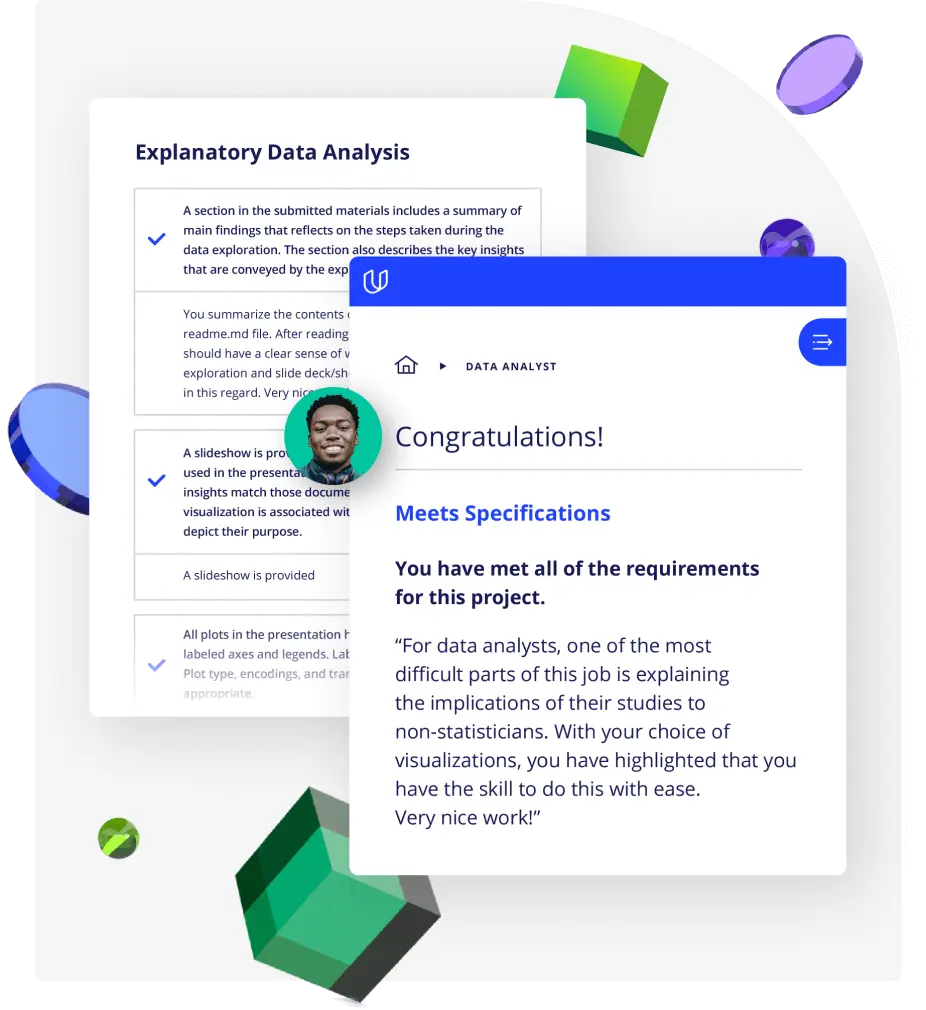
Reviewers provide timely and constructive feedback on your project submissions, highlighting areas of improvement and offering practical tips to enhance your work.
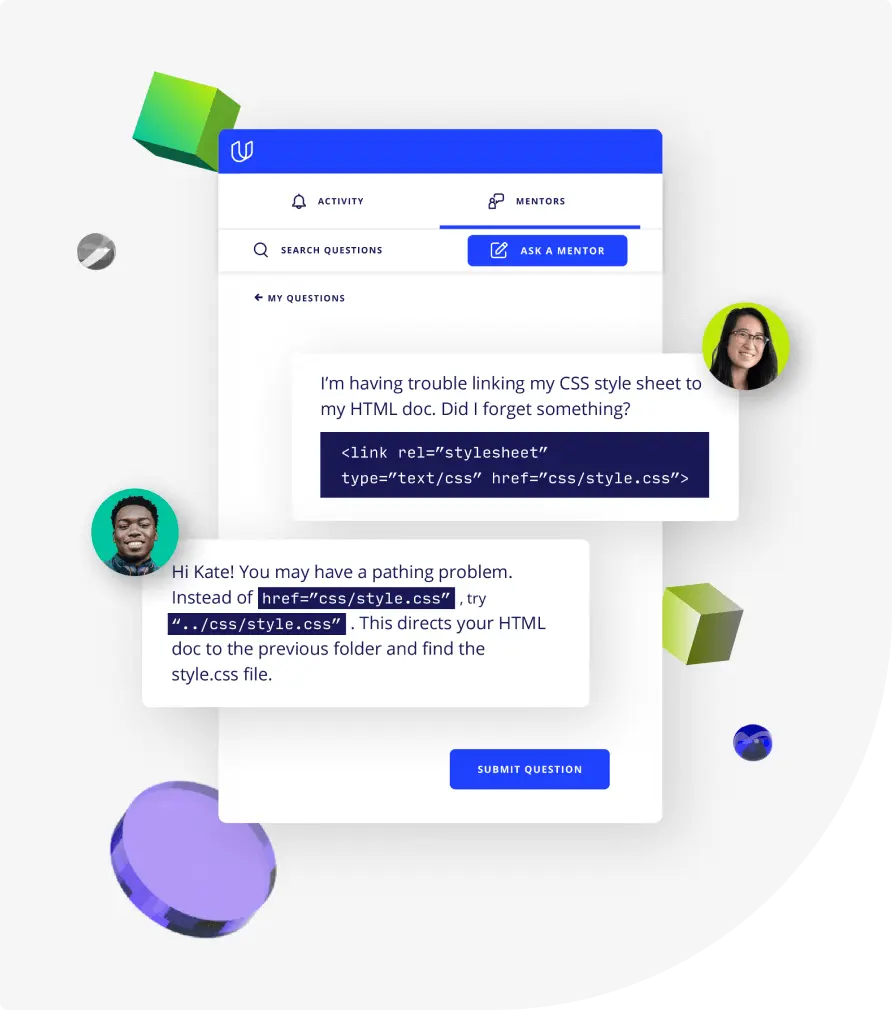
Get help from subject matter experts
Learn industry best practices
Gain valuable insights and improve your skills

Full Catalog Access
One subscription opens up this course and our entire catalog of projects and skills.
Average time to complete a Nanodegree program
3 weeks
, Advanced
3 weeks
, Intermediate
(124)
5 months
, Beginner
3 months
, Beginner
3 weeks
, Beginner
4 weeks
, Beginner
2 months
, Beginner
1 hour
, Discovery
4 weeks
, Intermediate
1 week
, Beginner
1 hour
, Discovery
20 hours
, Intermediate
1 month
, Beginner
3 weeks
, Beginner
(807)
2 months
, Beginner

Data Visualization with Matplotlib and Seaborn
3 weeks
, Advanced
3 weeks
, Intermediate
(124)
5 months
, Beginner
3 months
, Beginner
3 weeks
, Beginner
4 weeks
, Beginner
2 months
, Beginner
1 hour
, Discovery
4 weeks
, Intermediate
1 week
, Beginner
1 hour
, Discovery
20 hours
, Intermediate
1 month
, Beginner
3 weeks
, Beginner
(807)
2 months
, Beginner