Lesson 1
What is EDA?
Learn about what exploratory data analysis (EDA) is and why it is important.

Course
Data is everywhere and so much of it is unexplored. Learn how to investigate and summarize data sets using R and eventually create your own analysis.
Data is everywhere and so much of it is unexplored. Learn how to investigate and summarize data sets using R and eventually create your own analysis.
Last Updated March 4, 2022
Prerequisites:
No experience required
Lesson 1
Learn about what exploratory data analysis (EDA) is and why it is important.
Lesson 2
Install RStudio and packages, learn the layout and basic commands of R, practice writing basic R scripts, and inspect data sets.
Lesson 3
Learn how to quantify and visualize individual variables within a data set using histograms, boxplots, and transforms.
Lesson 4
Practice using R functions and univariate visualizations to explore and understand individual variables.
Lesson 5
Learn techniques for exploring the relationship between any two variables in a data set, including scatter plots, line plots, and correlations.
Lesson 6
Practice using bivariate exploration techniques to explore relationships between variables.
Lesson 7
Learn powerful methods for examining relationships among multiple variables, and find out how to reshape your data.
Lesson 8
Practice using multivariate exploration techniques to look at more complicated relationships between multiple variables.
Lesson 9
Put it all together in this case study where we investigate the diamonds data set alongside Facebook Data Scientist, Solomon Messing.
Lesson 10

Instructor

Instructor

Instructor

Instructor
Combine technology training for employees with industry experts, mentors, and projects, for critical thinking that pushes innovation. Our proven upskilling system goes after success—relentlessly.

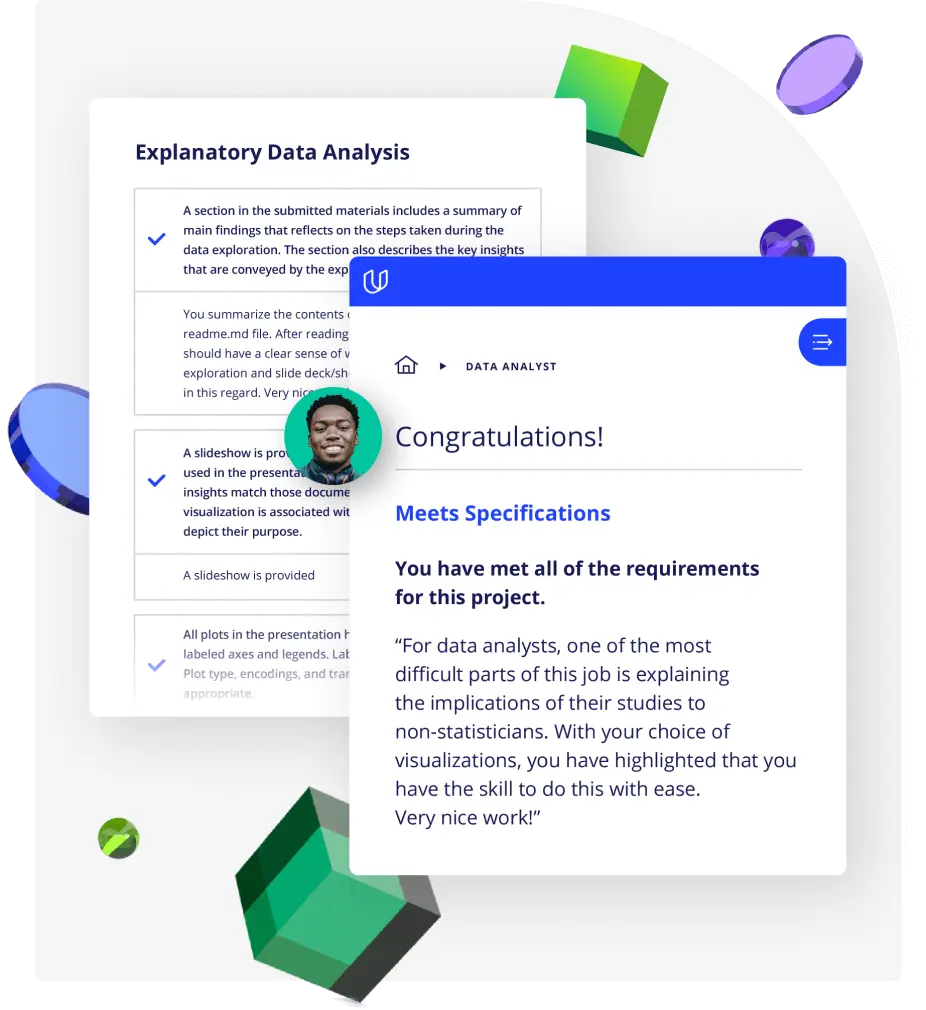
Demonstrate proficiency with practical projects
Projects are based on real-world scenarios and challenges, allowing you to apply the skills you learn to practical situations, while giving you real hands-on experience.
Gain proven experience
Retain knowledge longer
Apply new skills immediately

Top-tier services to ensure learner success
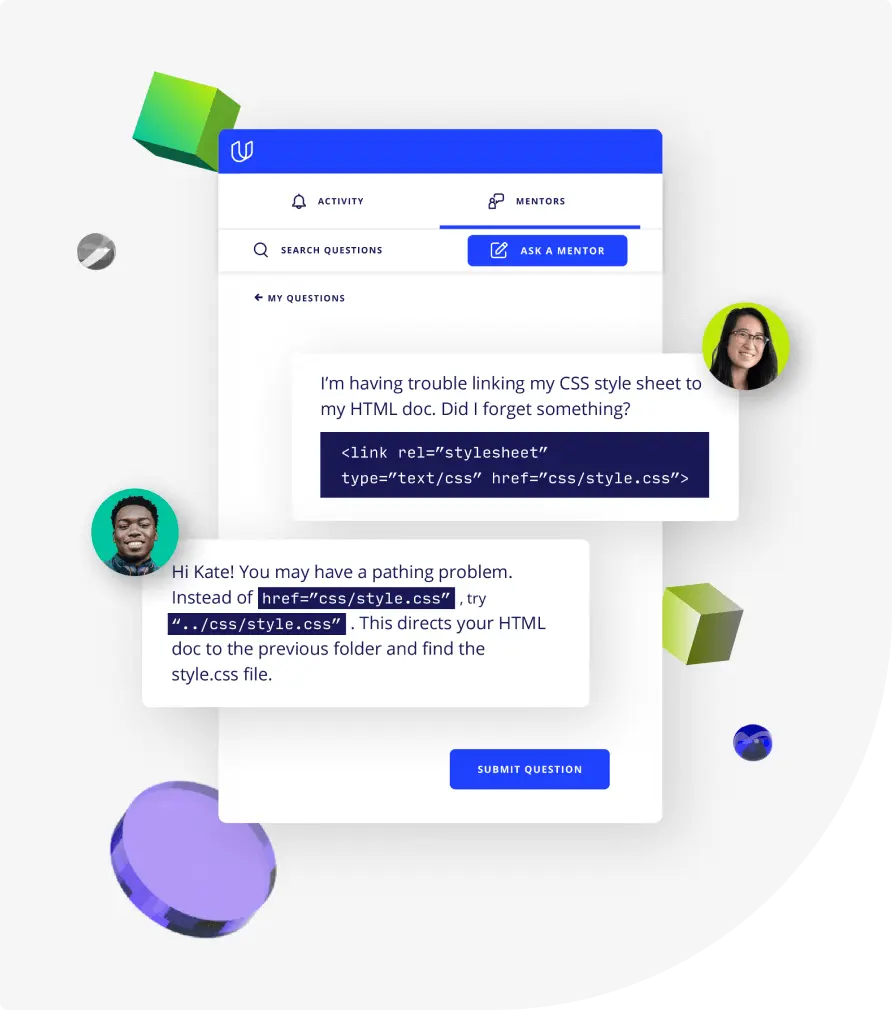
Reviewers provide timely and constructive feedback on your project submissions, highlighting areas of improvement and offering practical tips to enhance your work.
Get help from subject matter experts
Learn industry best practices
Gain valuable insights and improve your skills
20 hours
, Intermediate
3 weeks
, Advanced
Beginner
4 weeks
, Beginner
3 months
, Beginner
4 weeks
, Intermediate
4 weeks
, Beginner
(47)
2 months
, Beginner
3 days
, Intermediate
1 hour
, Discovery
3 weeks
, Beginner
5 hours