Are you looking for examples of using Python for data analysis? This article is for you. We will show you how to accomplish the most common data analysis tasks with Python, from the features of Python itself to using modules like Pandas to a simple machine learning example with TensorFlow. Let’s dive in.
A Note About Python Versions
All examples in this cheat sheet use Python 3. We recommend using the latest stable version of Python, for example, Python 3.8. You can check which version you have installed on your machine by running the following command in the system shell:
Sometimes, a development machine will have Python 2 and Python 3 installed side by side. Having two Python versions available is common on macOS. If that is the case for you, you can use the python3 command to run Python 3 even if Python 2 is the default in your environment: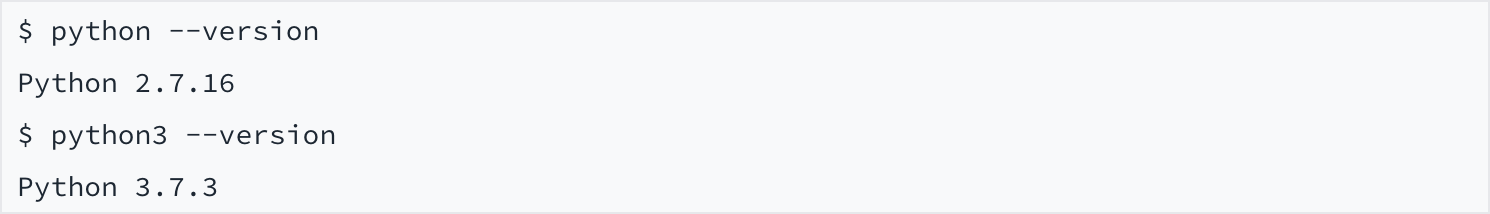
If you don’t have Python 3 installed yet, visit the Python Downloads page for instructions on installing it.
Launch a Python interpreter by running the python3 command in your shell: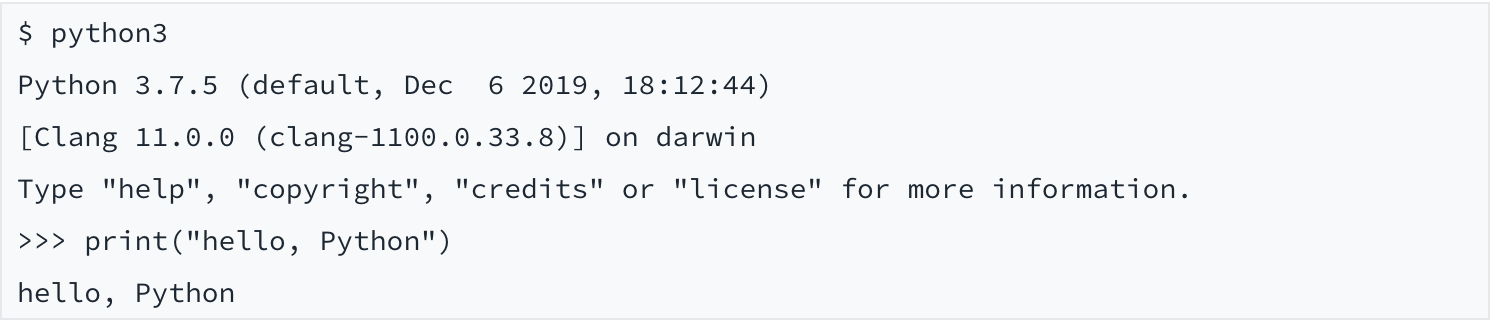
Libraries and Imports
The easiest way to install Python modules that are needed for data analysis is to use pip. Installing NumPy and Pandas takes only a few seconds: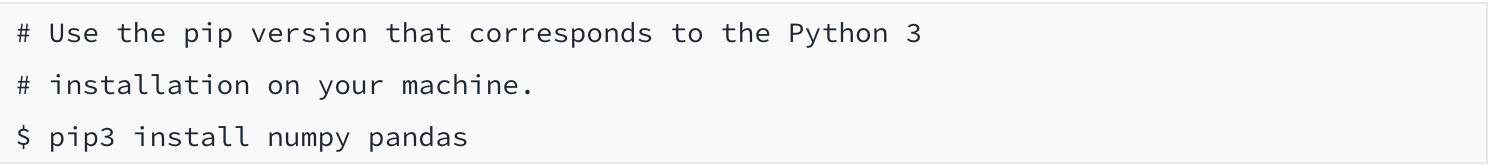
Once you’ve installed the modules, use the import statement to make the modules available in your program: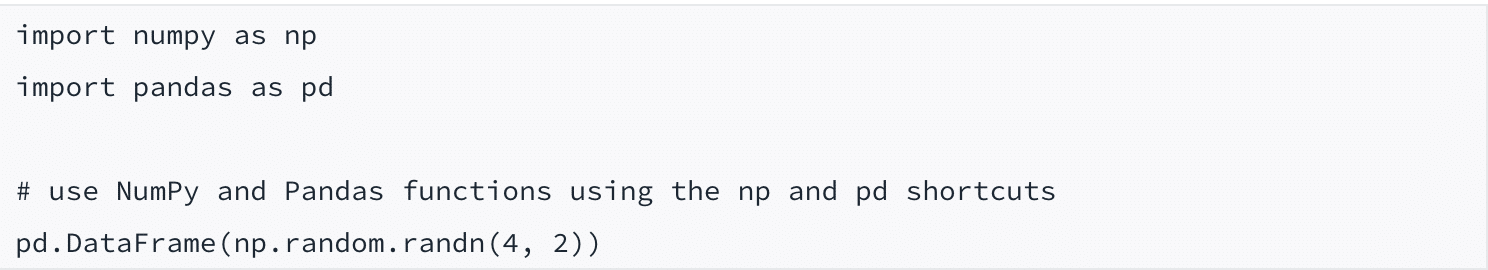
Getting Help With Python Data Analysis Functions
If you get stuck, the built-in Python docs are a great place to check for tips and ways to solve the problem. The Python help() function displays the help article for a method or a class:
The help function uses the system text pagination program, also known as the pager, to display the documentation. Many systems use less as the default text pager, just in case you aren’t familiar with the Vi shortcuts here are the basics:
- j and k navigate up and down line by line.
- / searches for content in a documentation page.
- After pressing / type in the search query, press Enter to go to the first occurrence.
- Press n and N to go forward and back through the search results.
- Ctrl+d and Ctrl+u move the cursor one page down and one page up, respectively.
Another useful place to check out for help articles is the online documentation for Python data analysis modules like Pandas and NumPy. For example, the Pandas user guides cover all the Pandas functionality with explanations and examples.
Basic language features
A quick tour through the Python basics: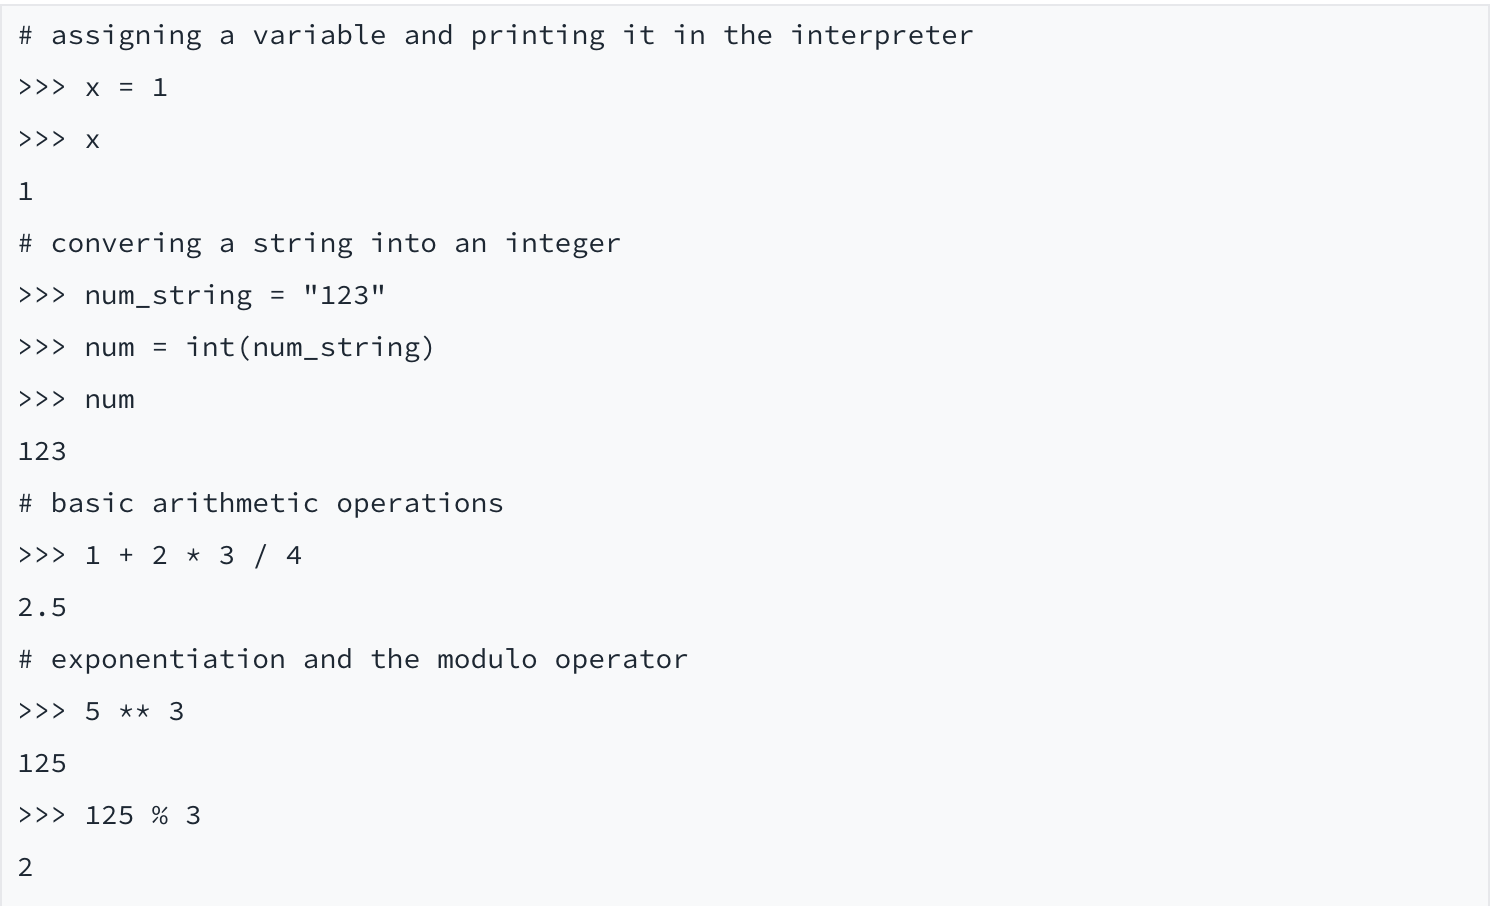
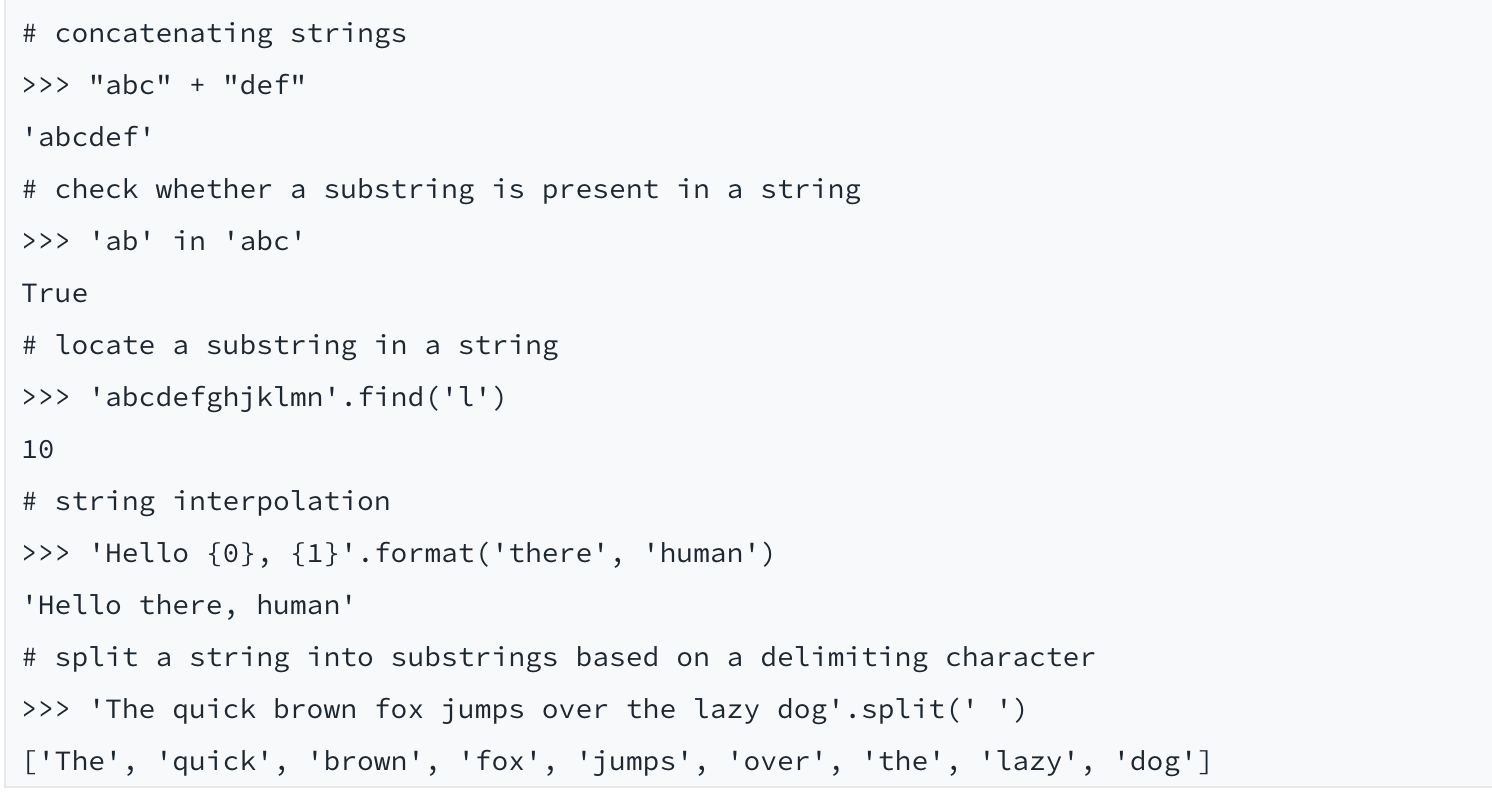
There are many more useful string methods in Python, find out more about them in the Python string docs.
Working with data sources
Pandas provides a number of easy-to-use data import methods, including CSV and TSV import, copying from the system clipboard, and reading and writing JSON files. This is sufficient for most Python data analysis tasks: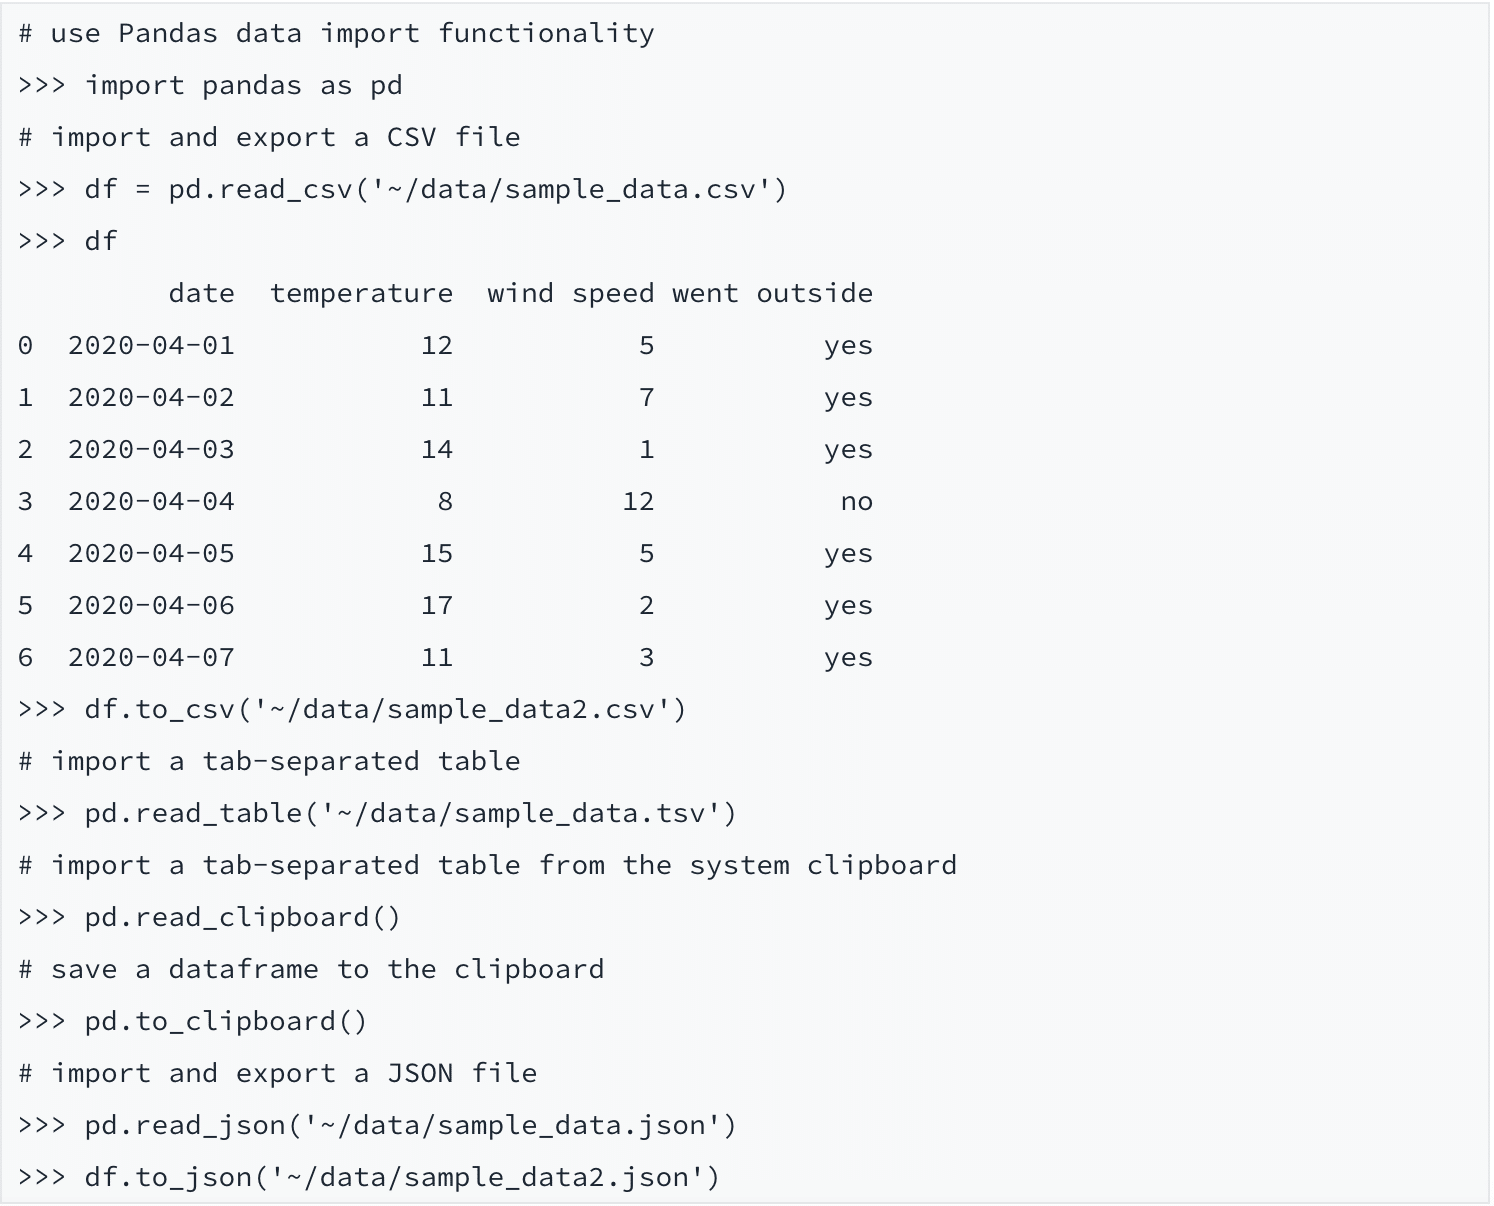
Find all other Pandas data import functions in the Pandas docs.
Working with Pandas Data Frames
Pandas data frames are a great way to explore, clean, tweak, and filter your data sets while doing data analysis in Python. This section covers a few of the things you can do with your Pandas data frames.
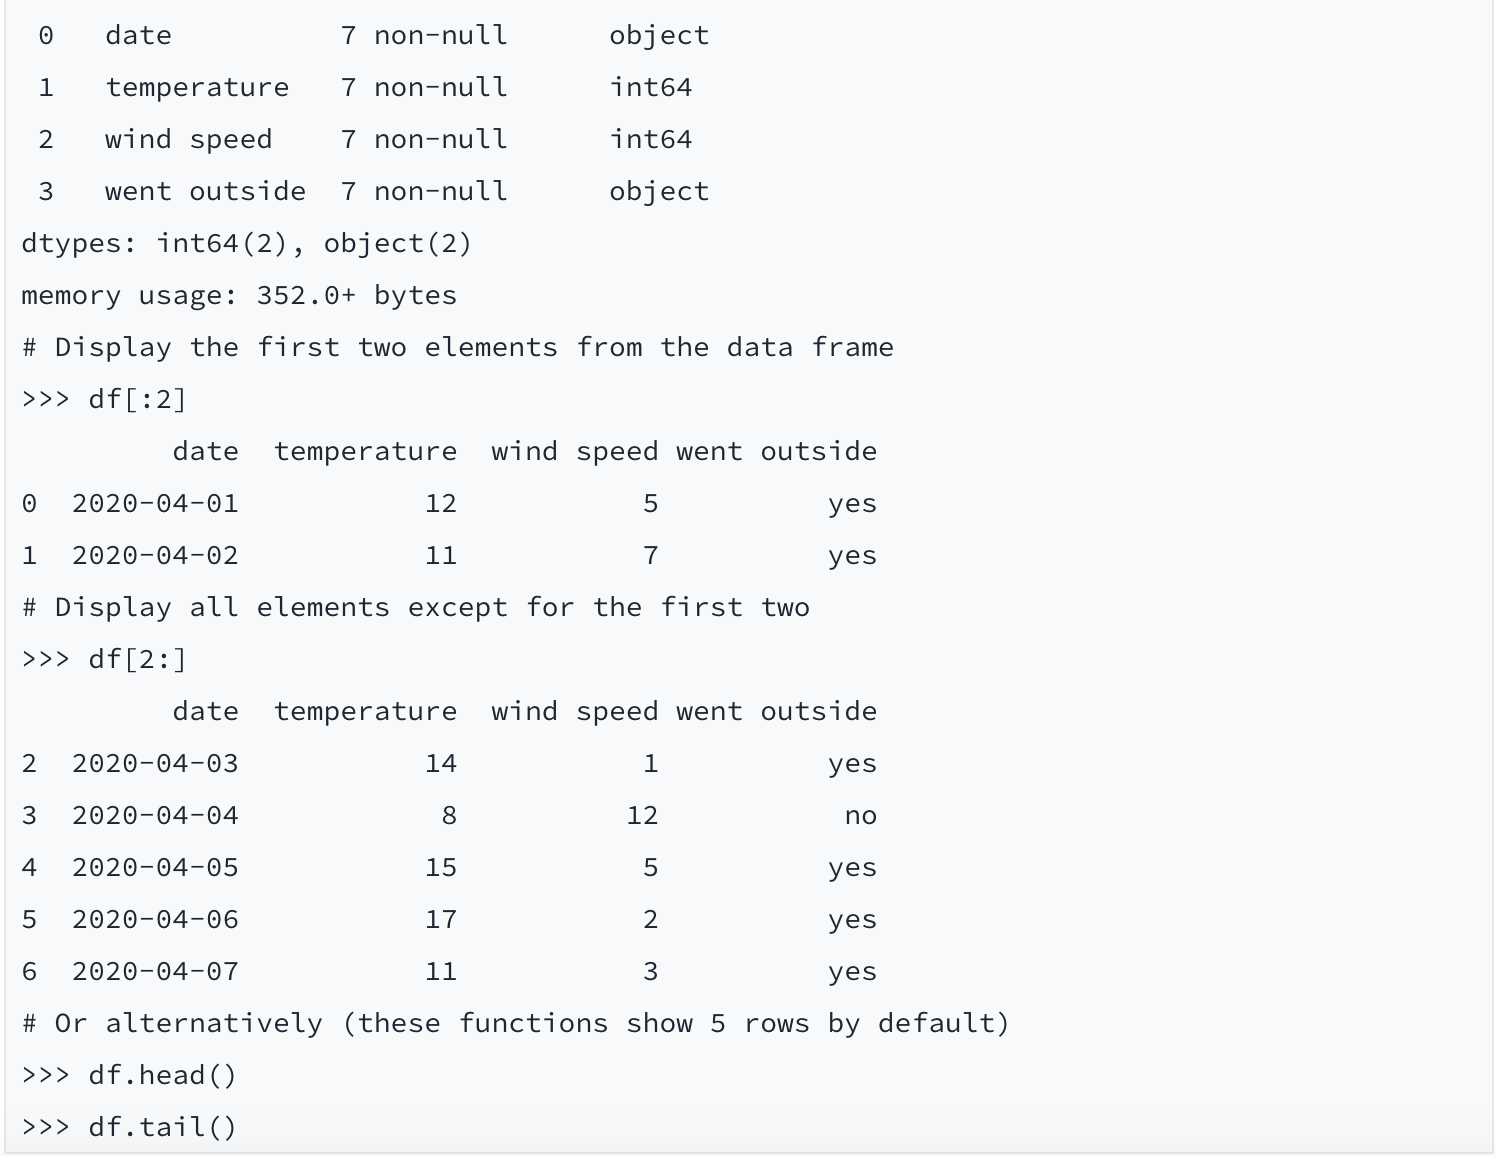
Exploring data
Here are a few functions that allow you to easily know more about the data set you are working on: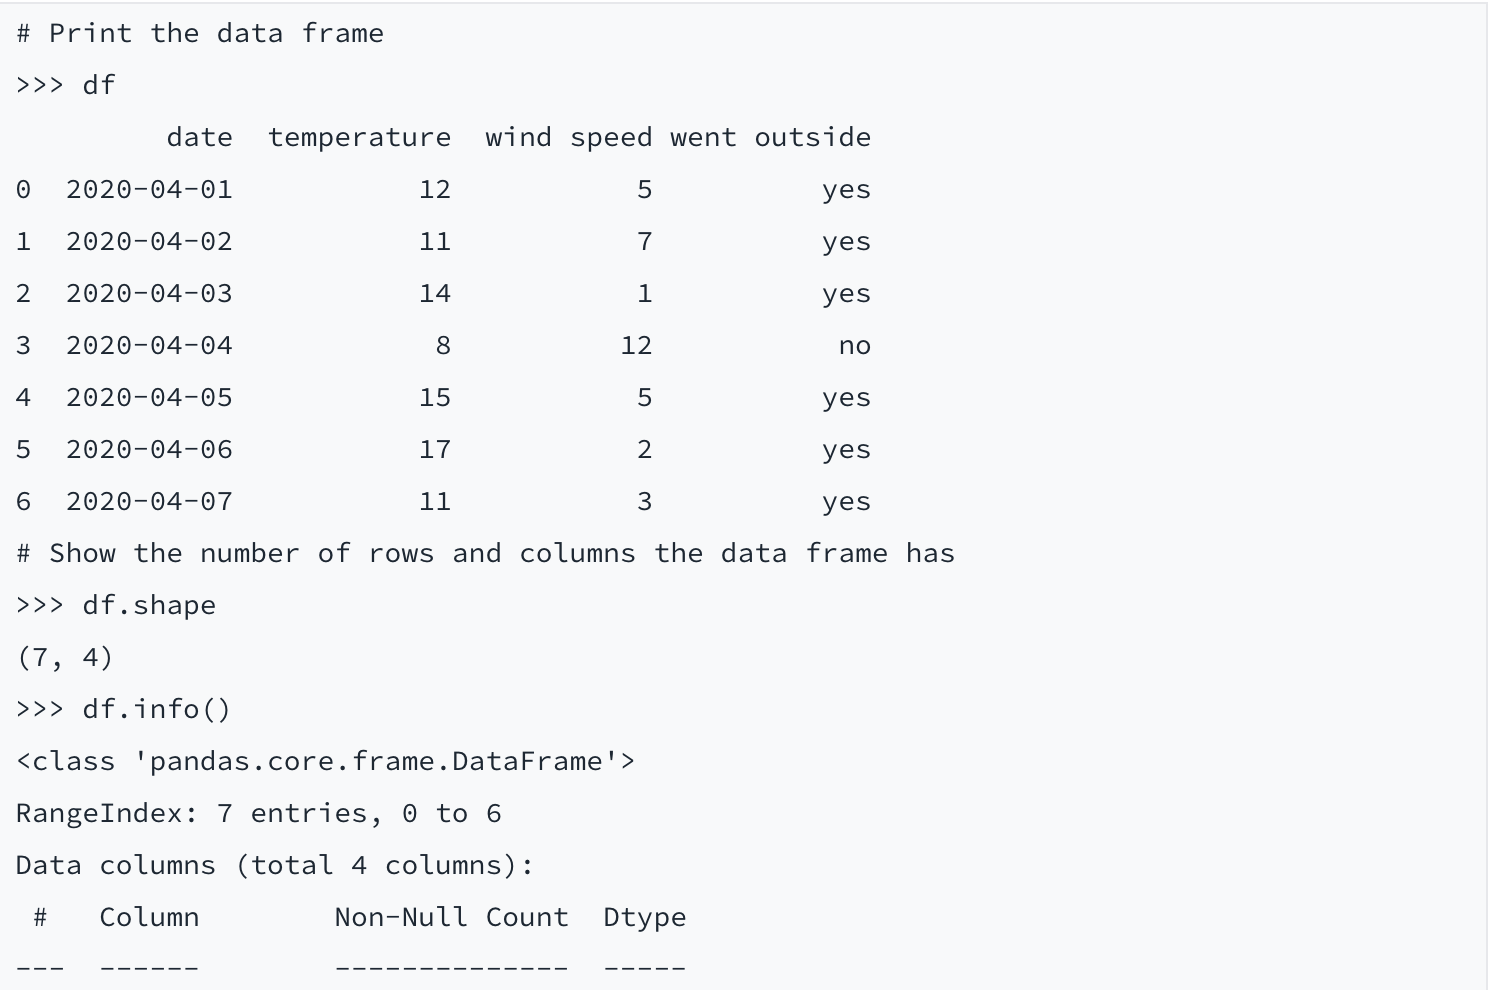
Statistical operations
All standard statistical operations like minimums, maximums, and custom quantiles are present in Pandas: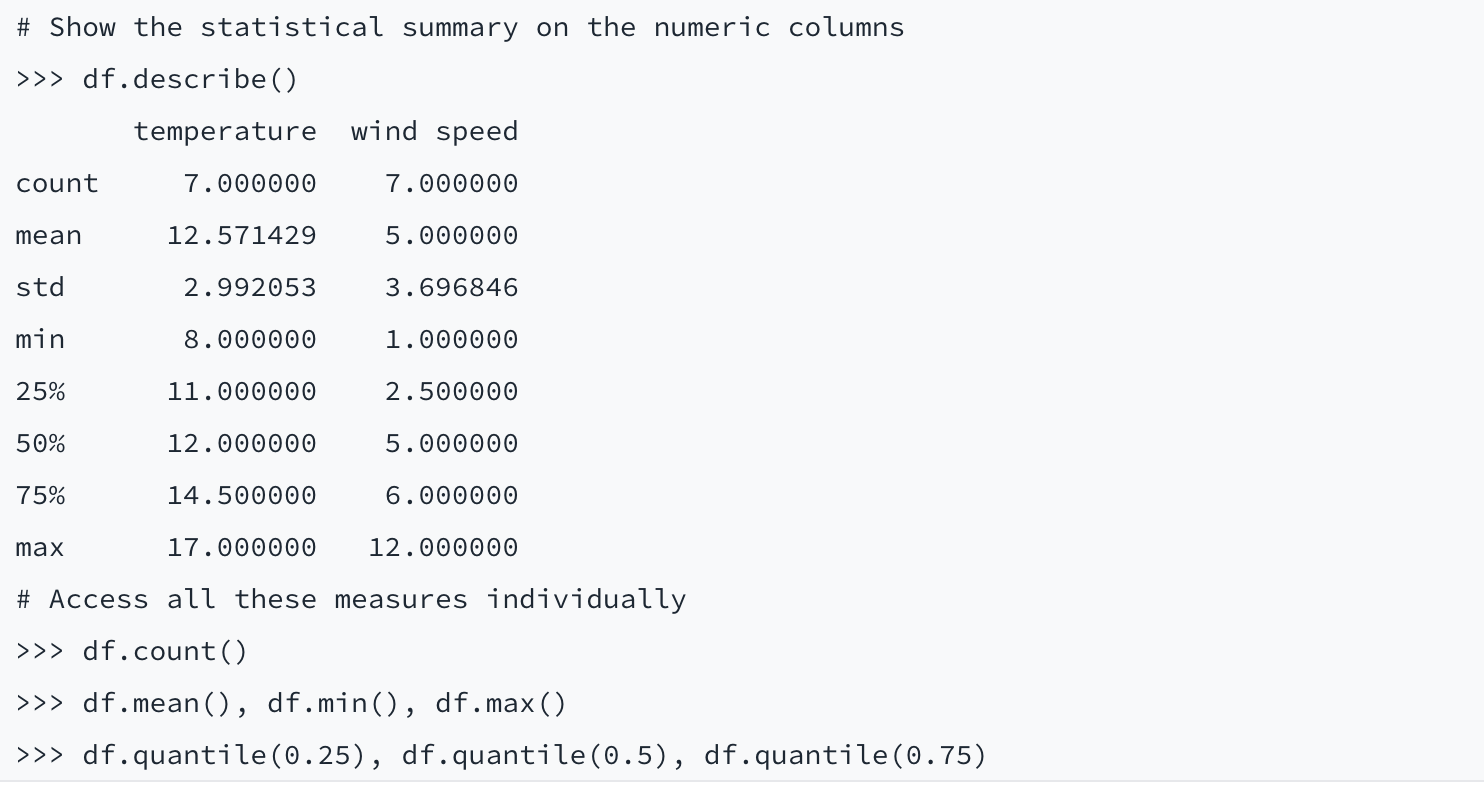
Cleaning the Data
It is quite common to have not-a-number (NaN) values in your data set. To be able to operate on a data set with statistical methods, you’ll first need to clean up the data. The fillna and dropna Pandas functions are a convenient way to replace the NaN values with something more representative for your data set, for example, a zero, or to remove the rows with NaN values from the data frame.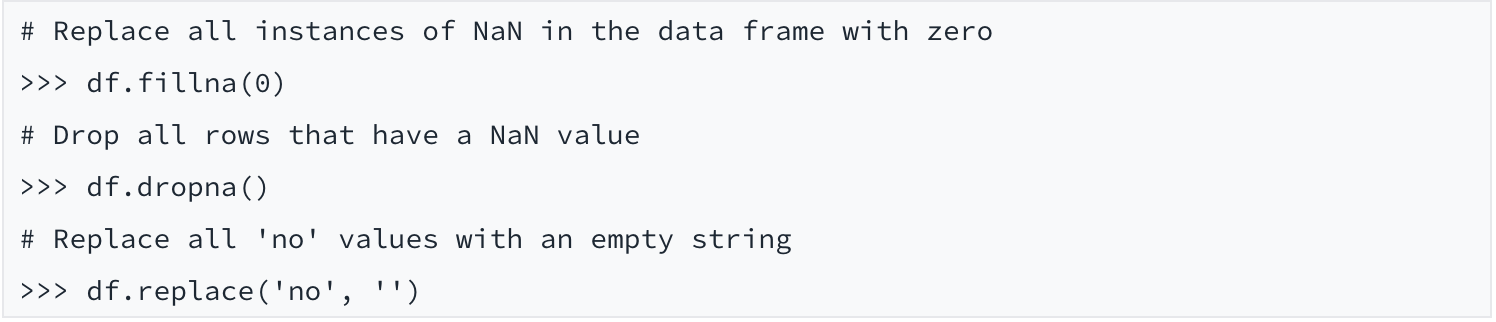
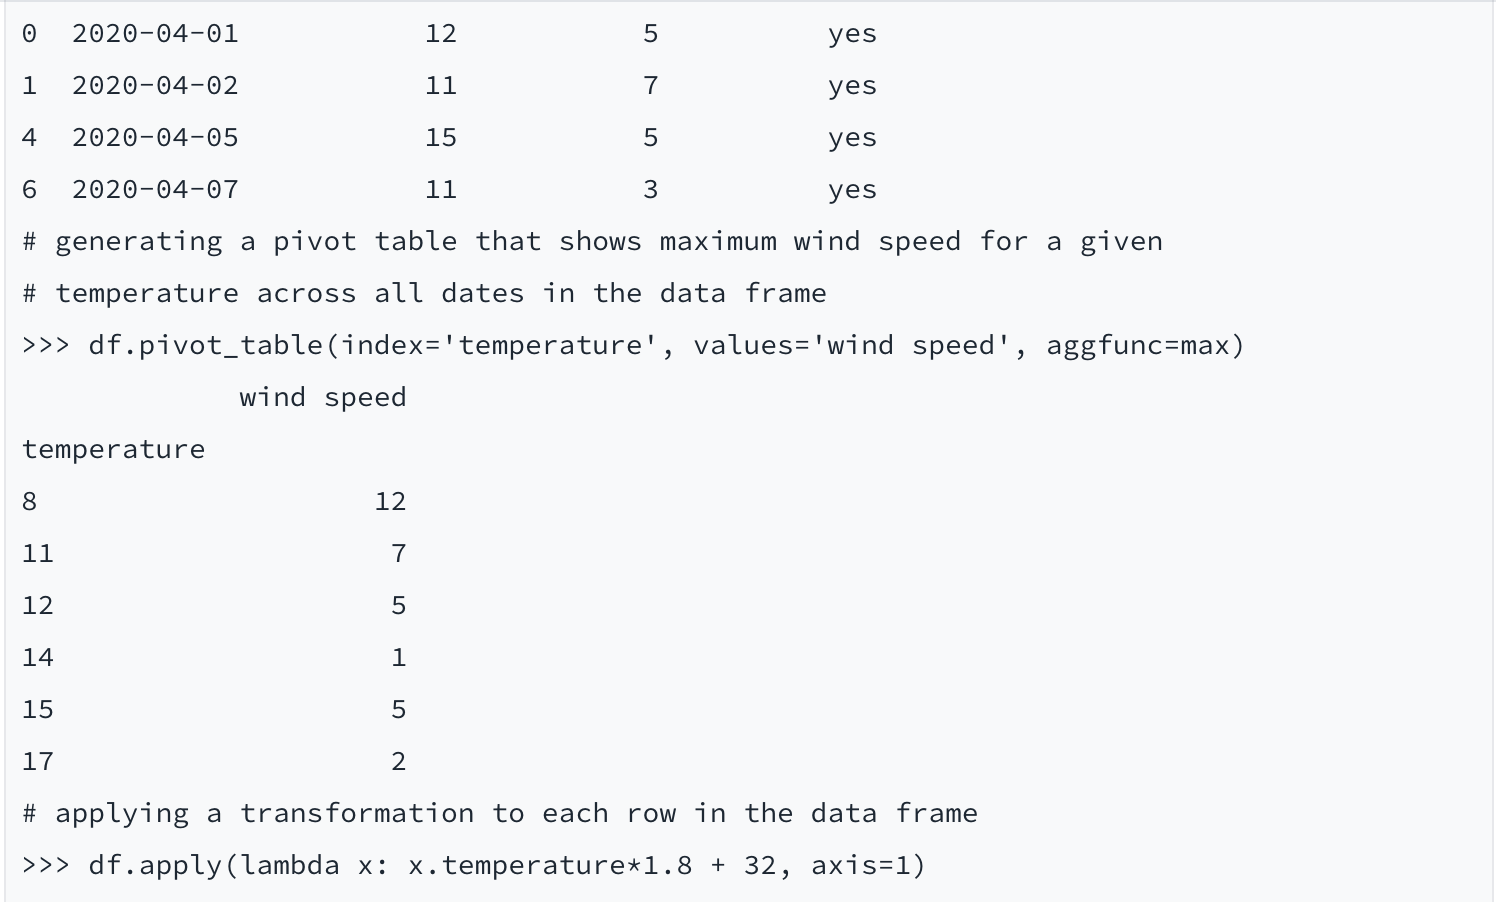
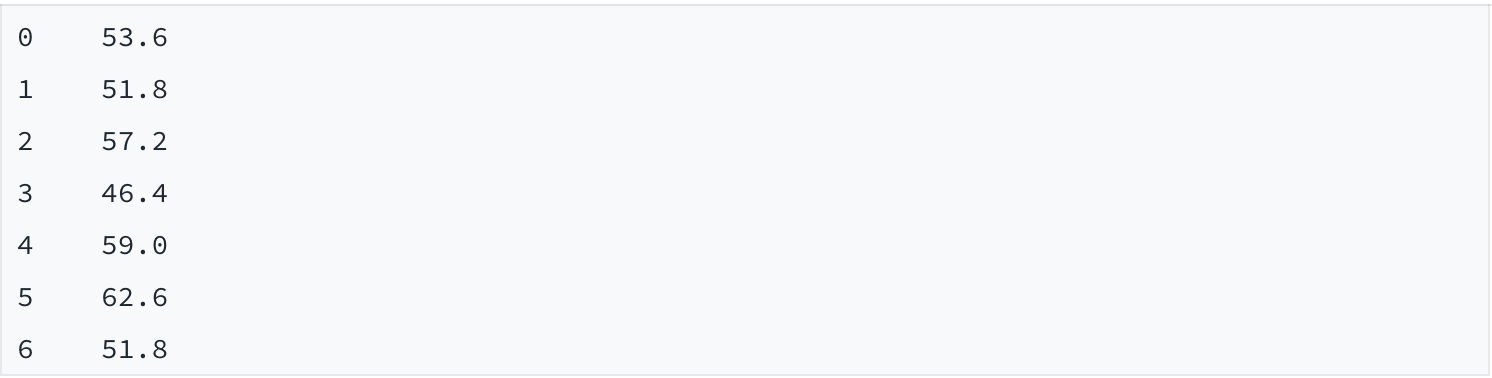
Filtering and sorting
Here are some basic commands for filtering and sorting the data in your data frames.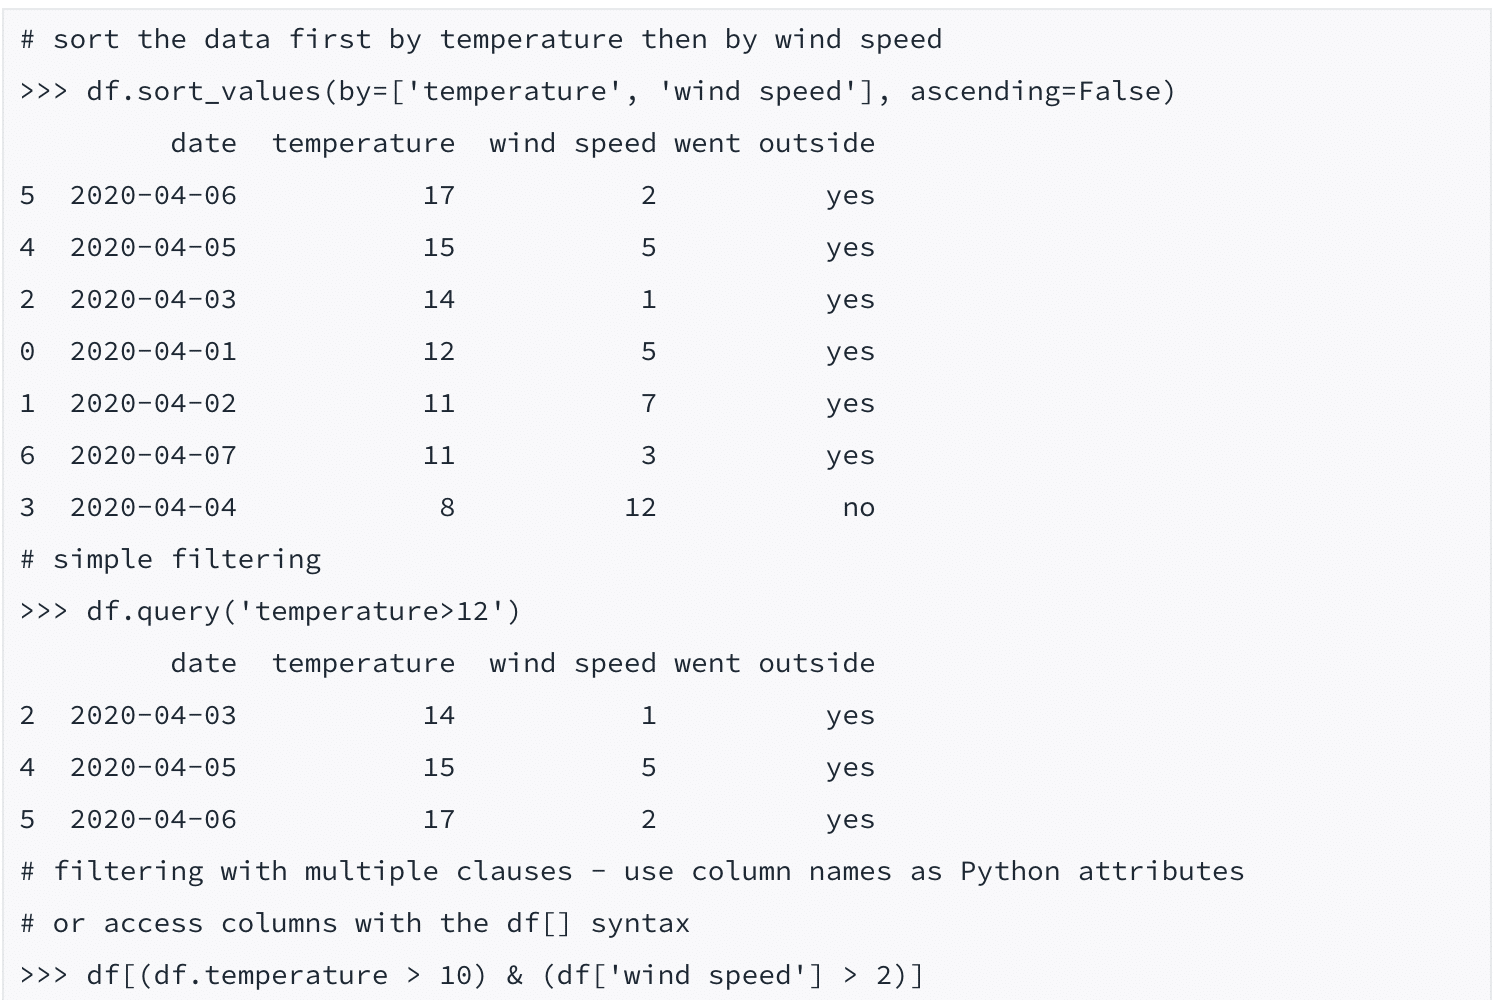
Machine Learning
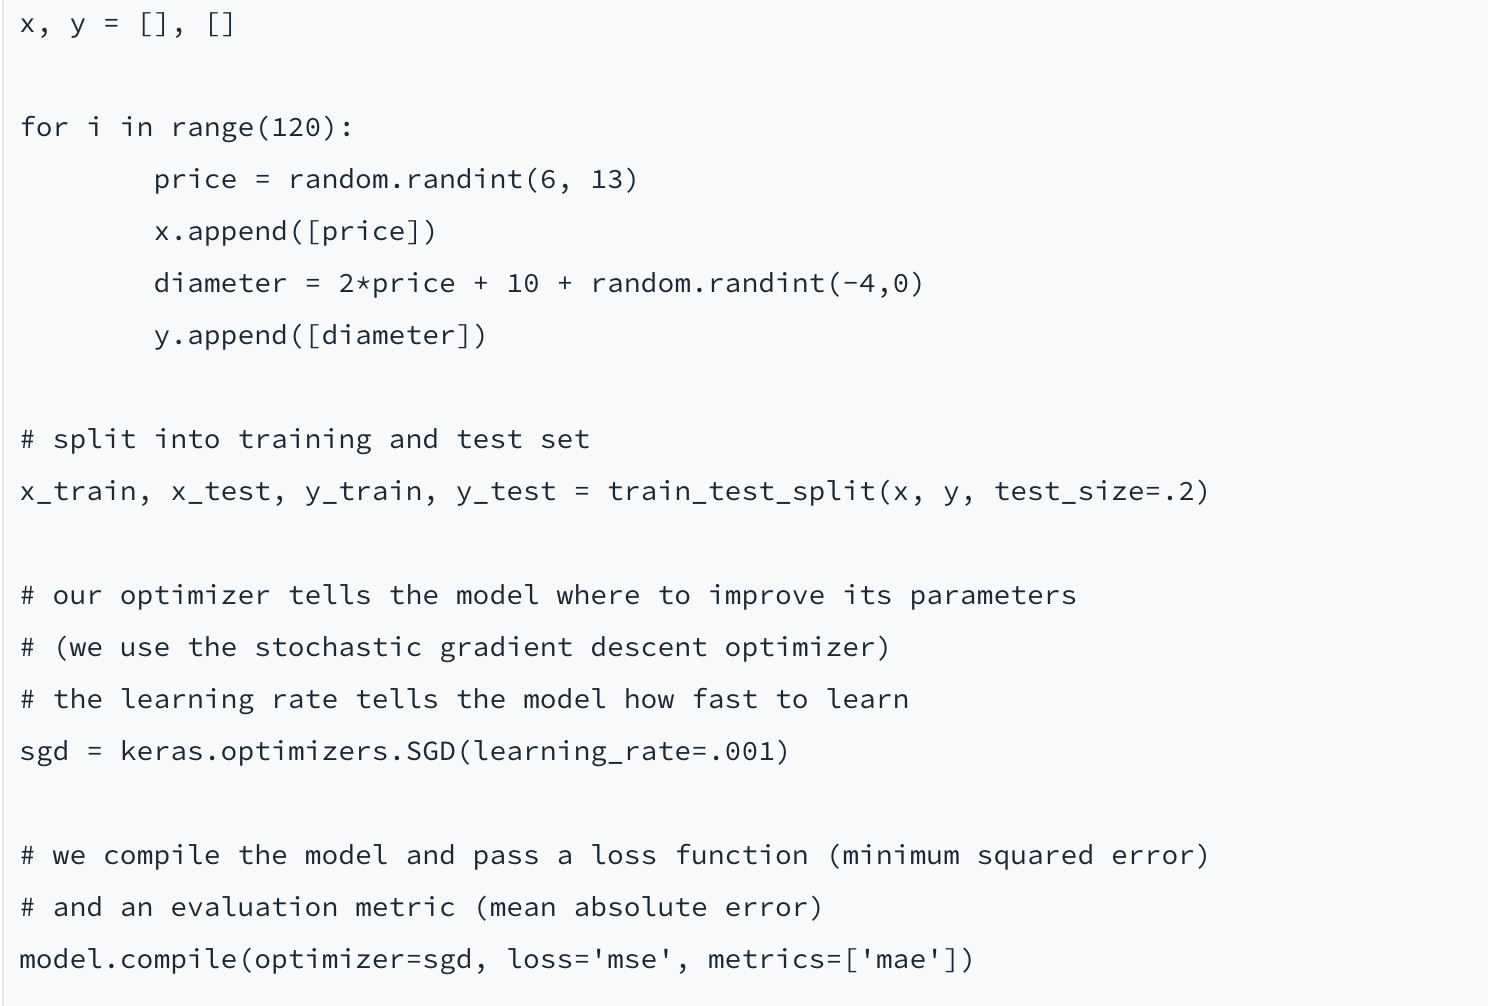
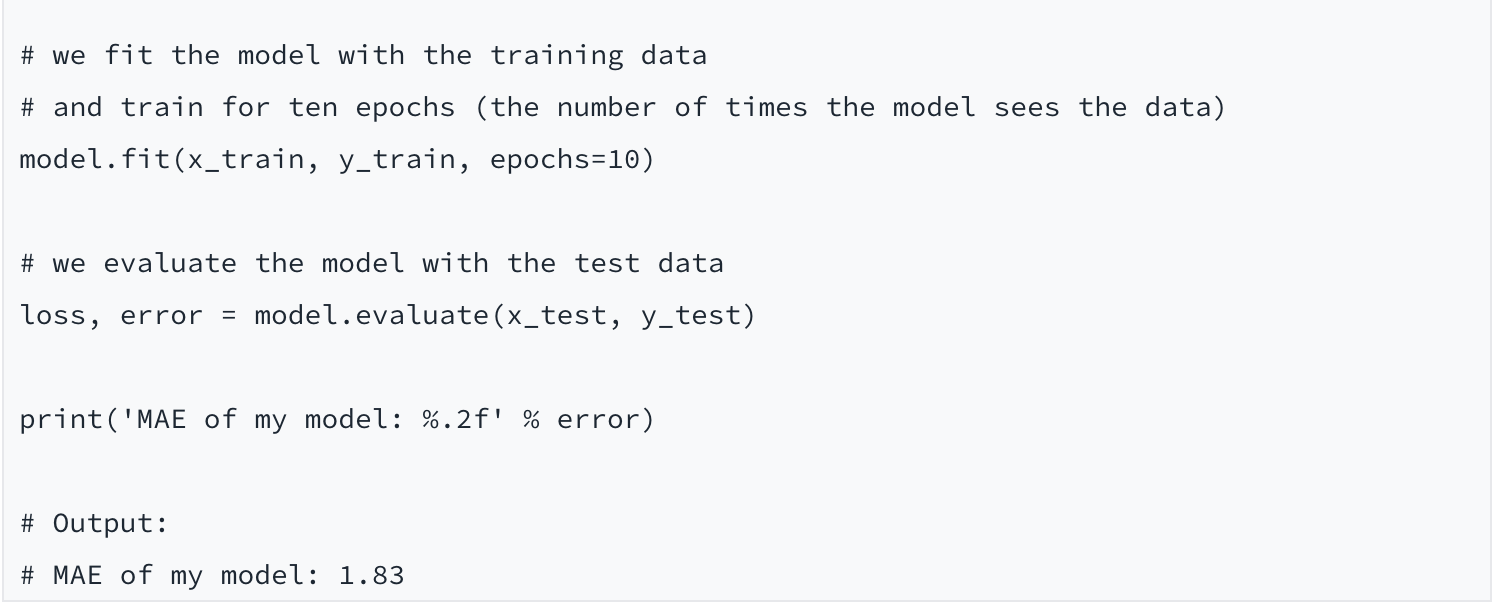
While machine learning algorithms can be incredibly complex, Python’s popular modules make creating a machine learning program straightforward. Below is an example of a simple ML algorithm that uses Python and its data analysis and machine learning modules, namely NumPy, TensorFlow, Keras, and SciKit-Learn.
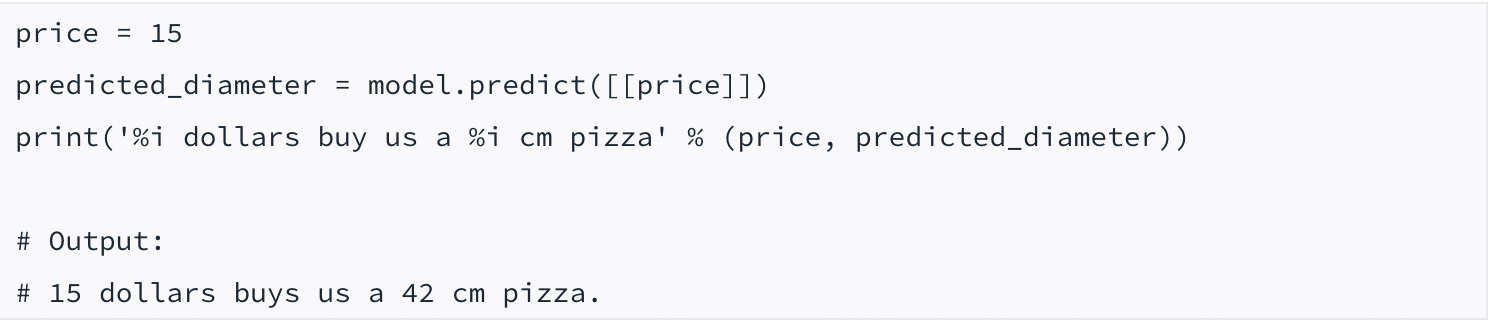
In this program, we generate a sample data set with pizza diameters and their respective prices, train the model on this data set, and then use the model to predict the price of a pizza of a diameter that we choose.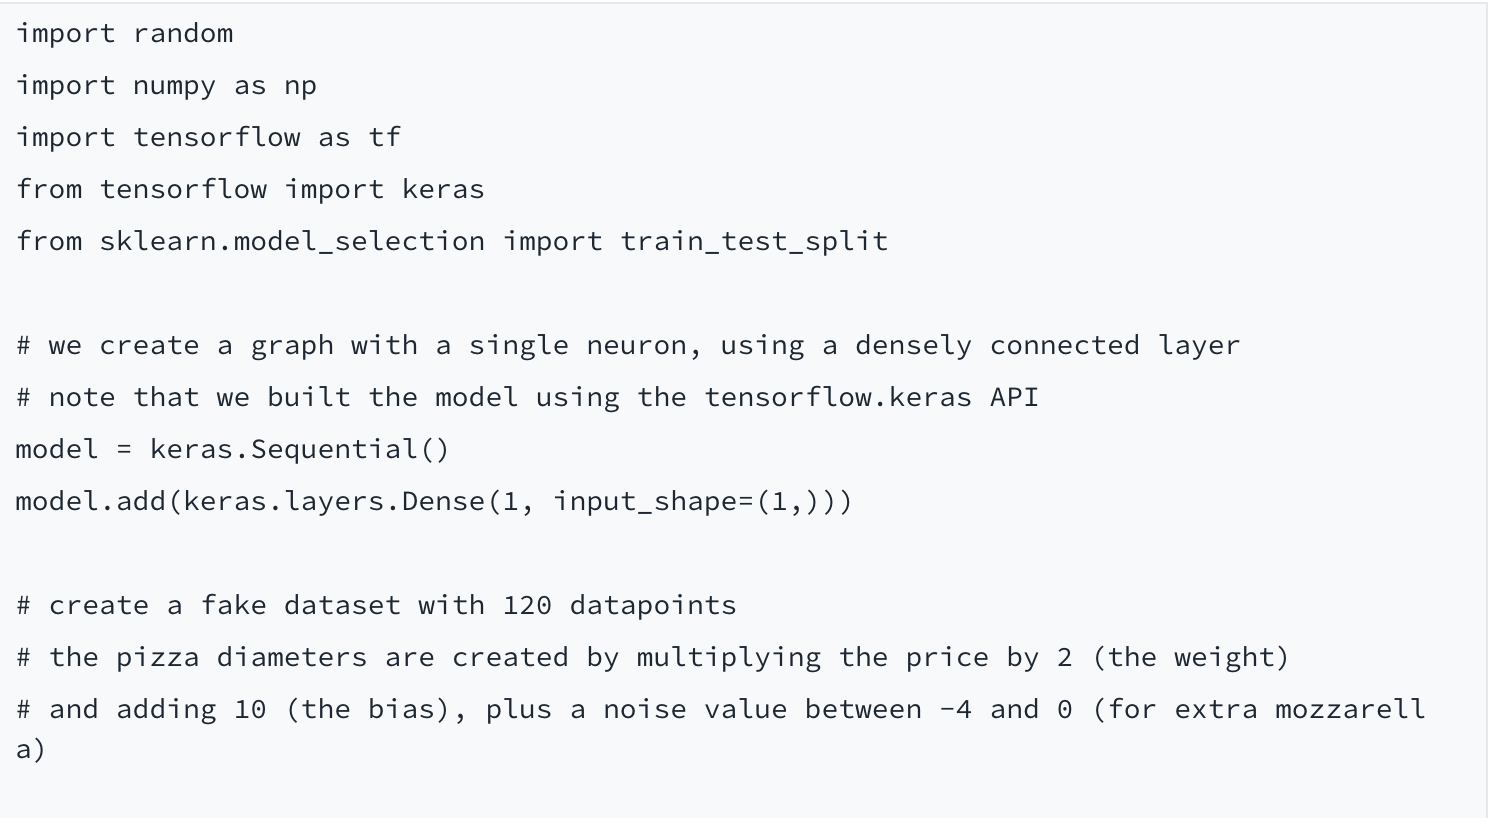
Once the model is set up we can use it to predict a result:
Summary
In this article, we’ve taken a look at the basics of using Python for data analysis. For more details on the functionality available in Pandas, visit the Pandas user guides. For more powerful math with NumPy (it can be used together with Pandas), check out the NumPy getting started guide.
To learn more about Python for data analysis, enroll in our Data Analysis Nanodegree program today.