At Udacity, we don’t just teach the latest Data and AI skills, we make use of data ourselves, to continuously improve our students’ learning experiences.
Here’s a notable example for how we do this.
In early 2017, we introduced the following dialog after each lesson in all of our Nanodegree programs:
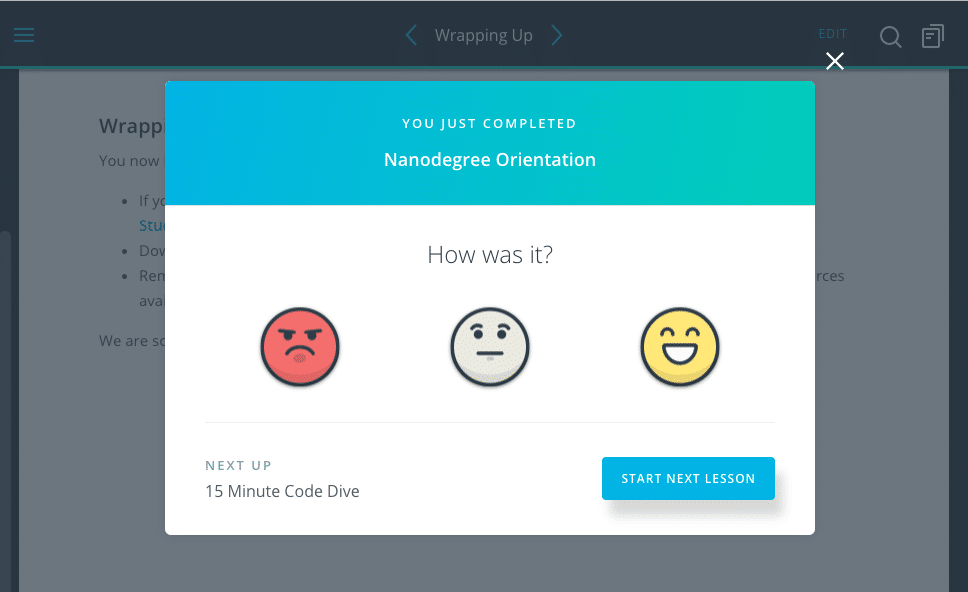
Students are not required to respond, but the majority do. In fact, 154,897 students—across 20 different Nanodegree programs—provided 1,575,237 pieces of feedback in the last year. They clicked on negative, neutral, or positive emoticons, and additionally, courtesy of a text field that pops up after a response, they were able to share feedback in their own words.
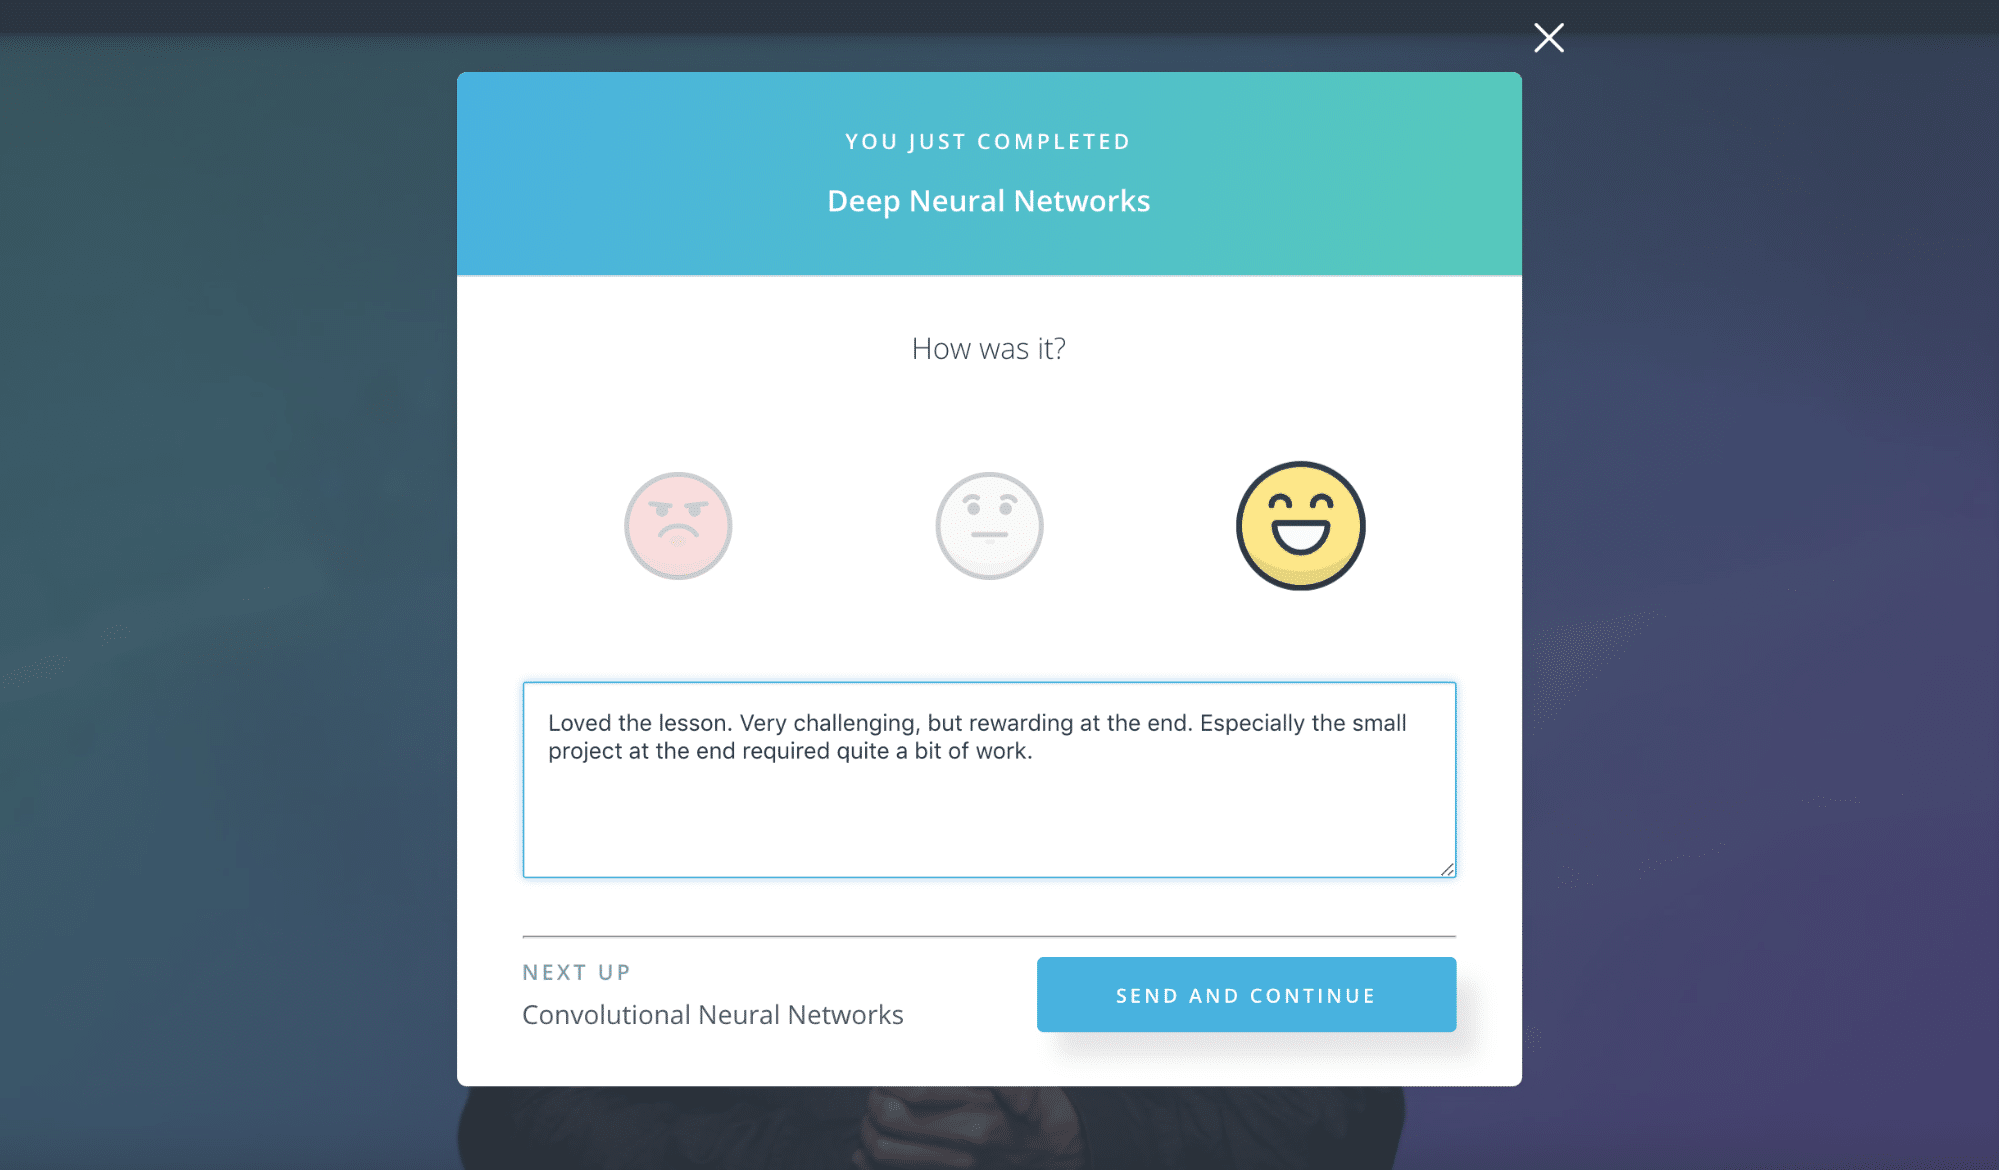
Student feedback ranges from the very positive (as below, in response to our Deep Learning Nanodegree program):
- “Really Interesting! The example/quizzes were great. The summary page was BRILLIANT!”
- “Superb content.”
- “Super tough but super awesome.”
- “All lessons from Luis in the Nanodegree are very awesome.”
To the negative and frustrated (also Deep Learning):
- “Notebook server launches but I cannot create a new notebook.”
- “Audio level too low.”
- “I am confused. Should I be opening an account with AWS or no?”
Taking Action
We take action on this feedback in many ways. At the highest level, our learning and data teams track the overall development of the feedback signals we receive from our students, to understand the big picture of how we’re doing. Are we trending positive or negative across all our offerings? Are these trends steady over time, or are we seeing fluctuations? Our goal is to understand how successfully we’re advancing our mission, and to ensure we’re expanding our reach while at the same time increasing our quality.
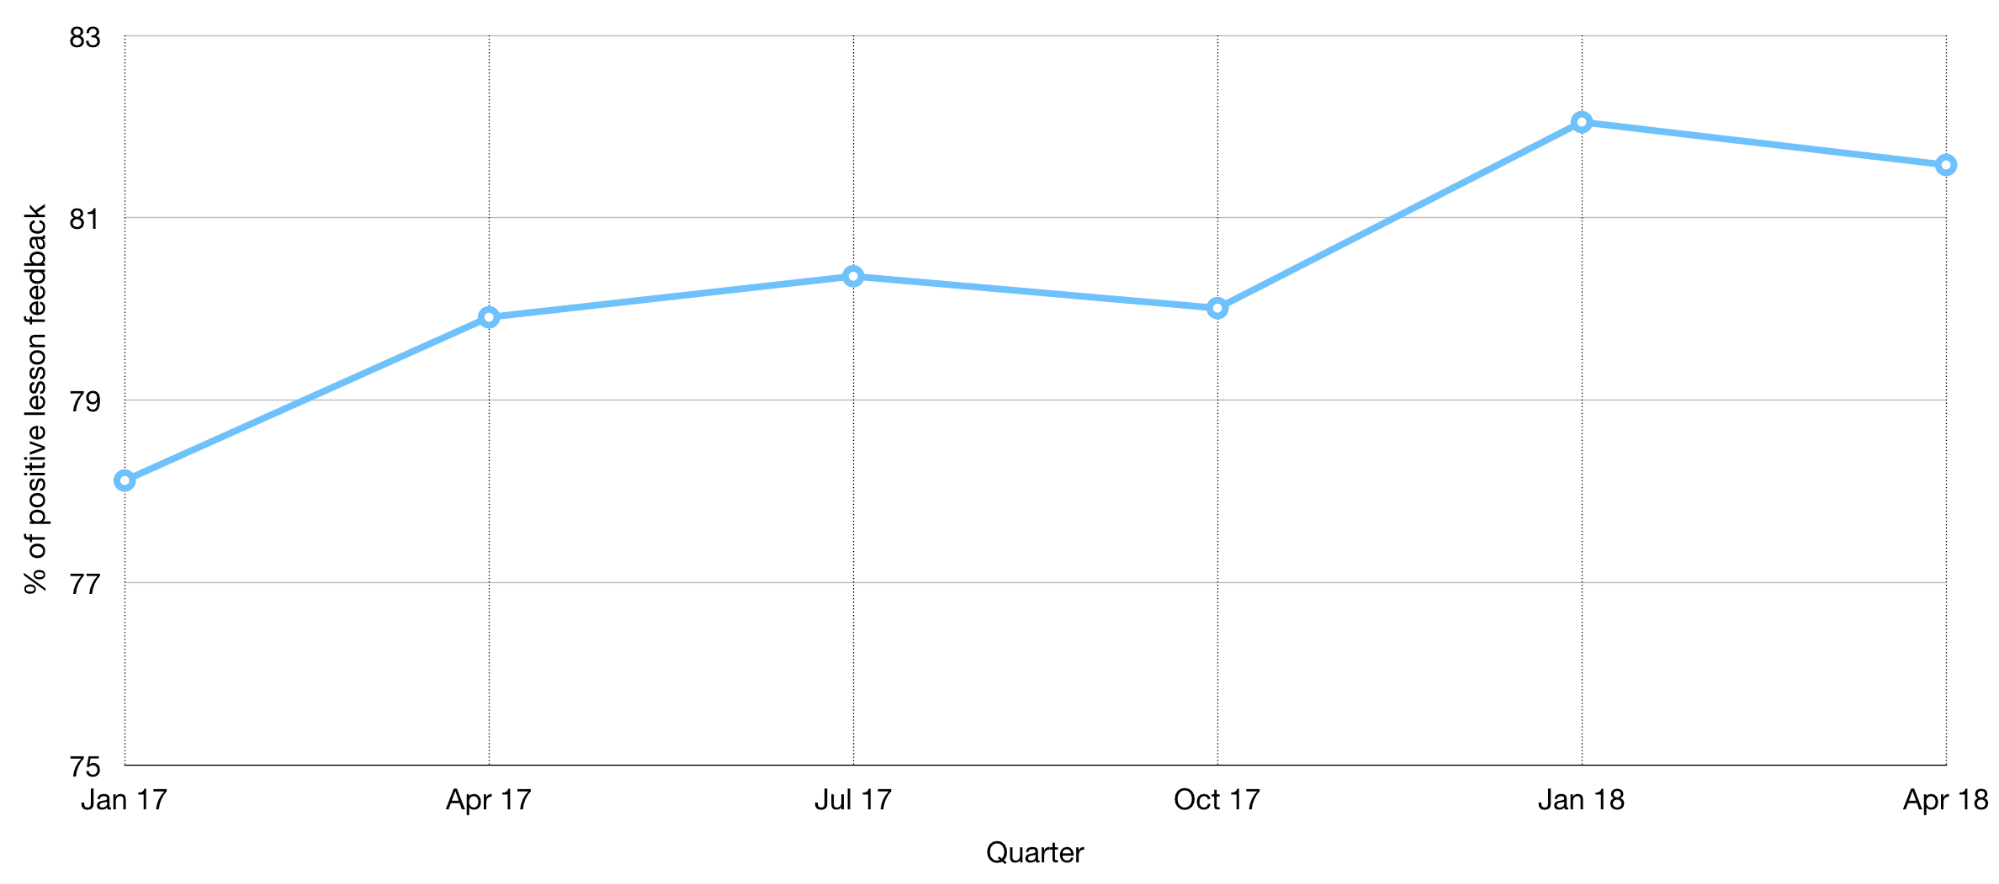
Based on this data, we can see that positive feedback has increased significantly across all our programs from January 2017 until today. This is an important signal, because it shows us that—even as we launch new lessons and projects, and grow our catalog—we’re still able to continuously improve quality based on student feedback across both existing and new content.
In addition to looking at our overall signal, we can also plot each program individually, and visualize where students are expressing frustration or dissatisfaction:
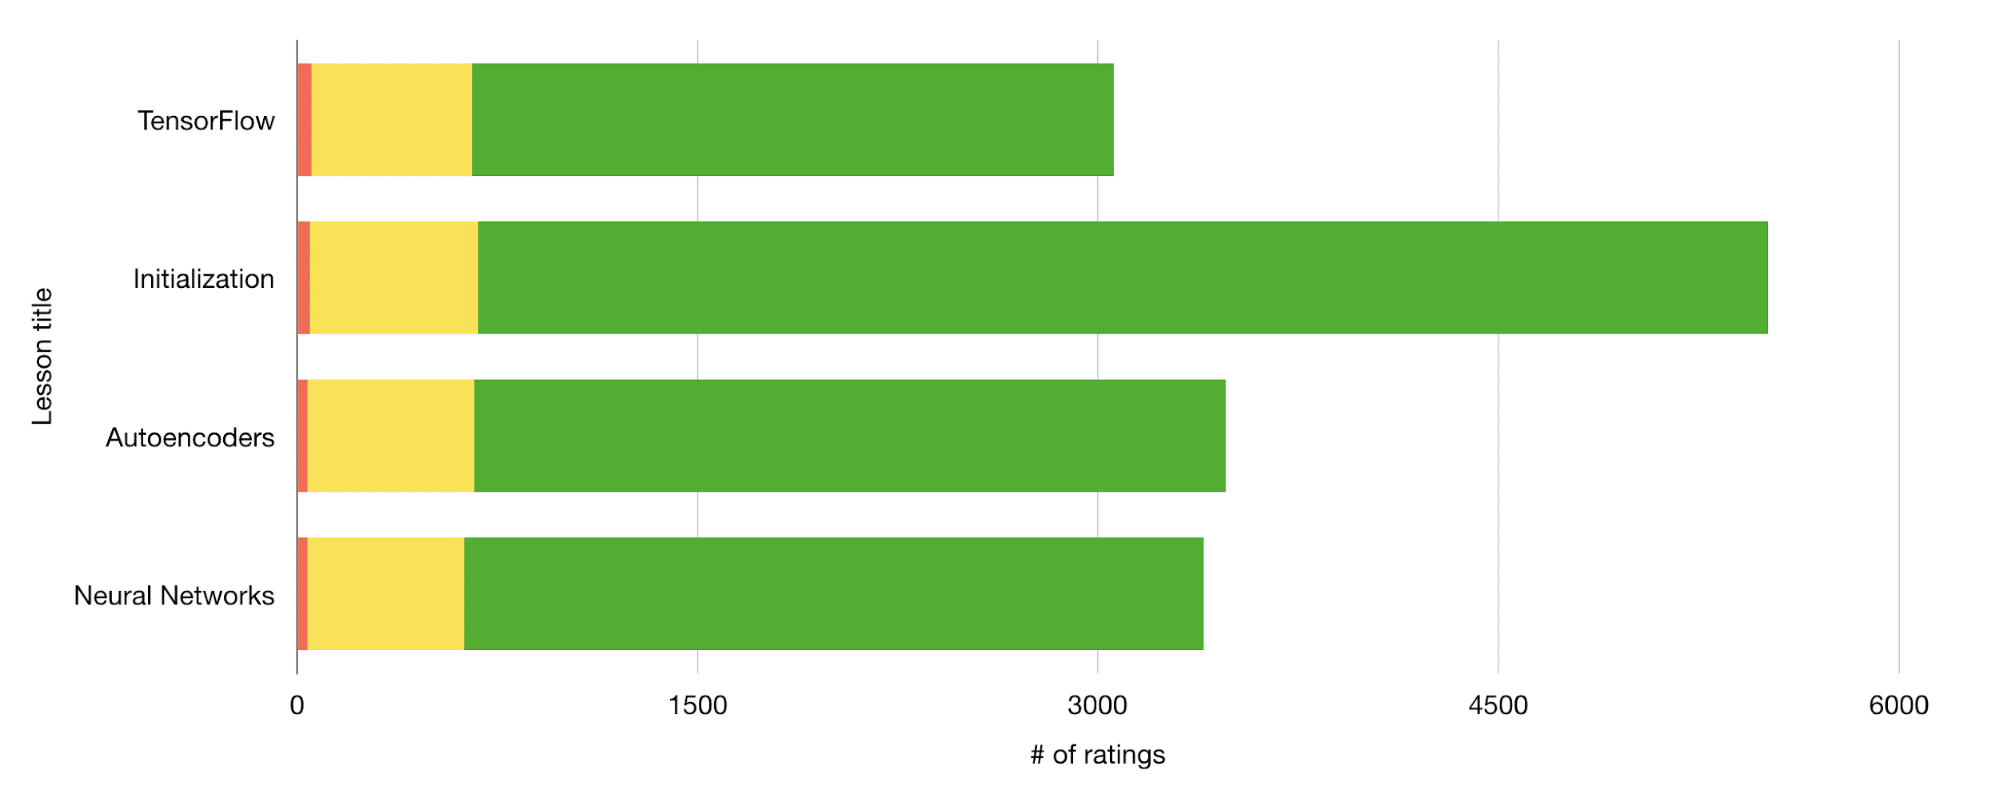
In the chart above, we can see the individual ratings for lessons in our Deep Learning Nanodegree program. The green section shows the number of positive ratings, yellow shows neutral ratings, and the red represents negative ratings.
These signals help our content development and student experience teams prioritize, and focus on the areas where there is the highest potential for improving the student experience.
More often than not, the feedback we receive and process includes very concrete and actionable content:
- “I can understand the instructor’s English perfectly, but she talks too fast”
- “There are several grammar mistakes in this chapter. In Lesson 2 – 7. Quiz – 2 of the questions use ‘where’ instead of the passive verb ‘were.’”
even:
- “The plants in your office need more water.”
When we see patterns emerge across multiple responses, this provides an opportunity to go in and make tangible improvements to lessons, projects, and other student experiences.
When we do make a change, we can then easily and quickly determine whether an implemented change is actually leading to an improved experience—within days of launching that change.
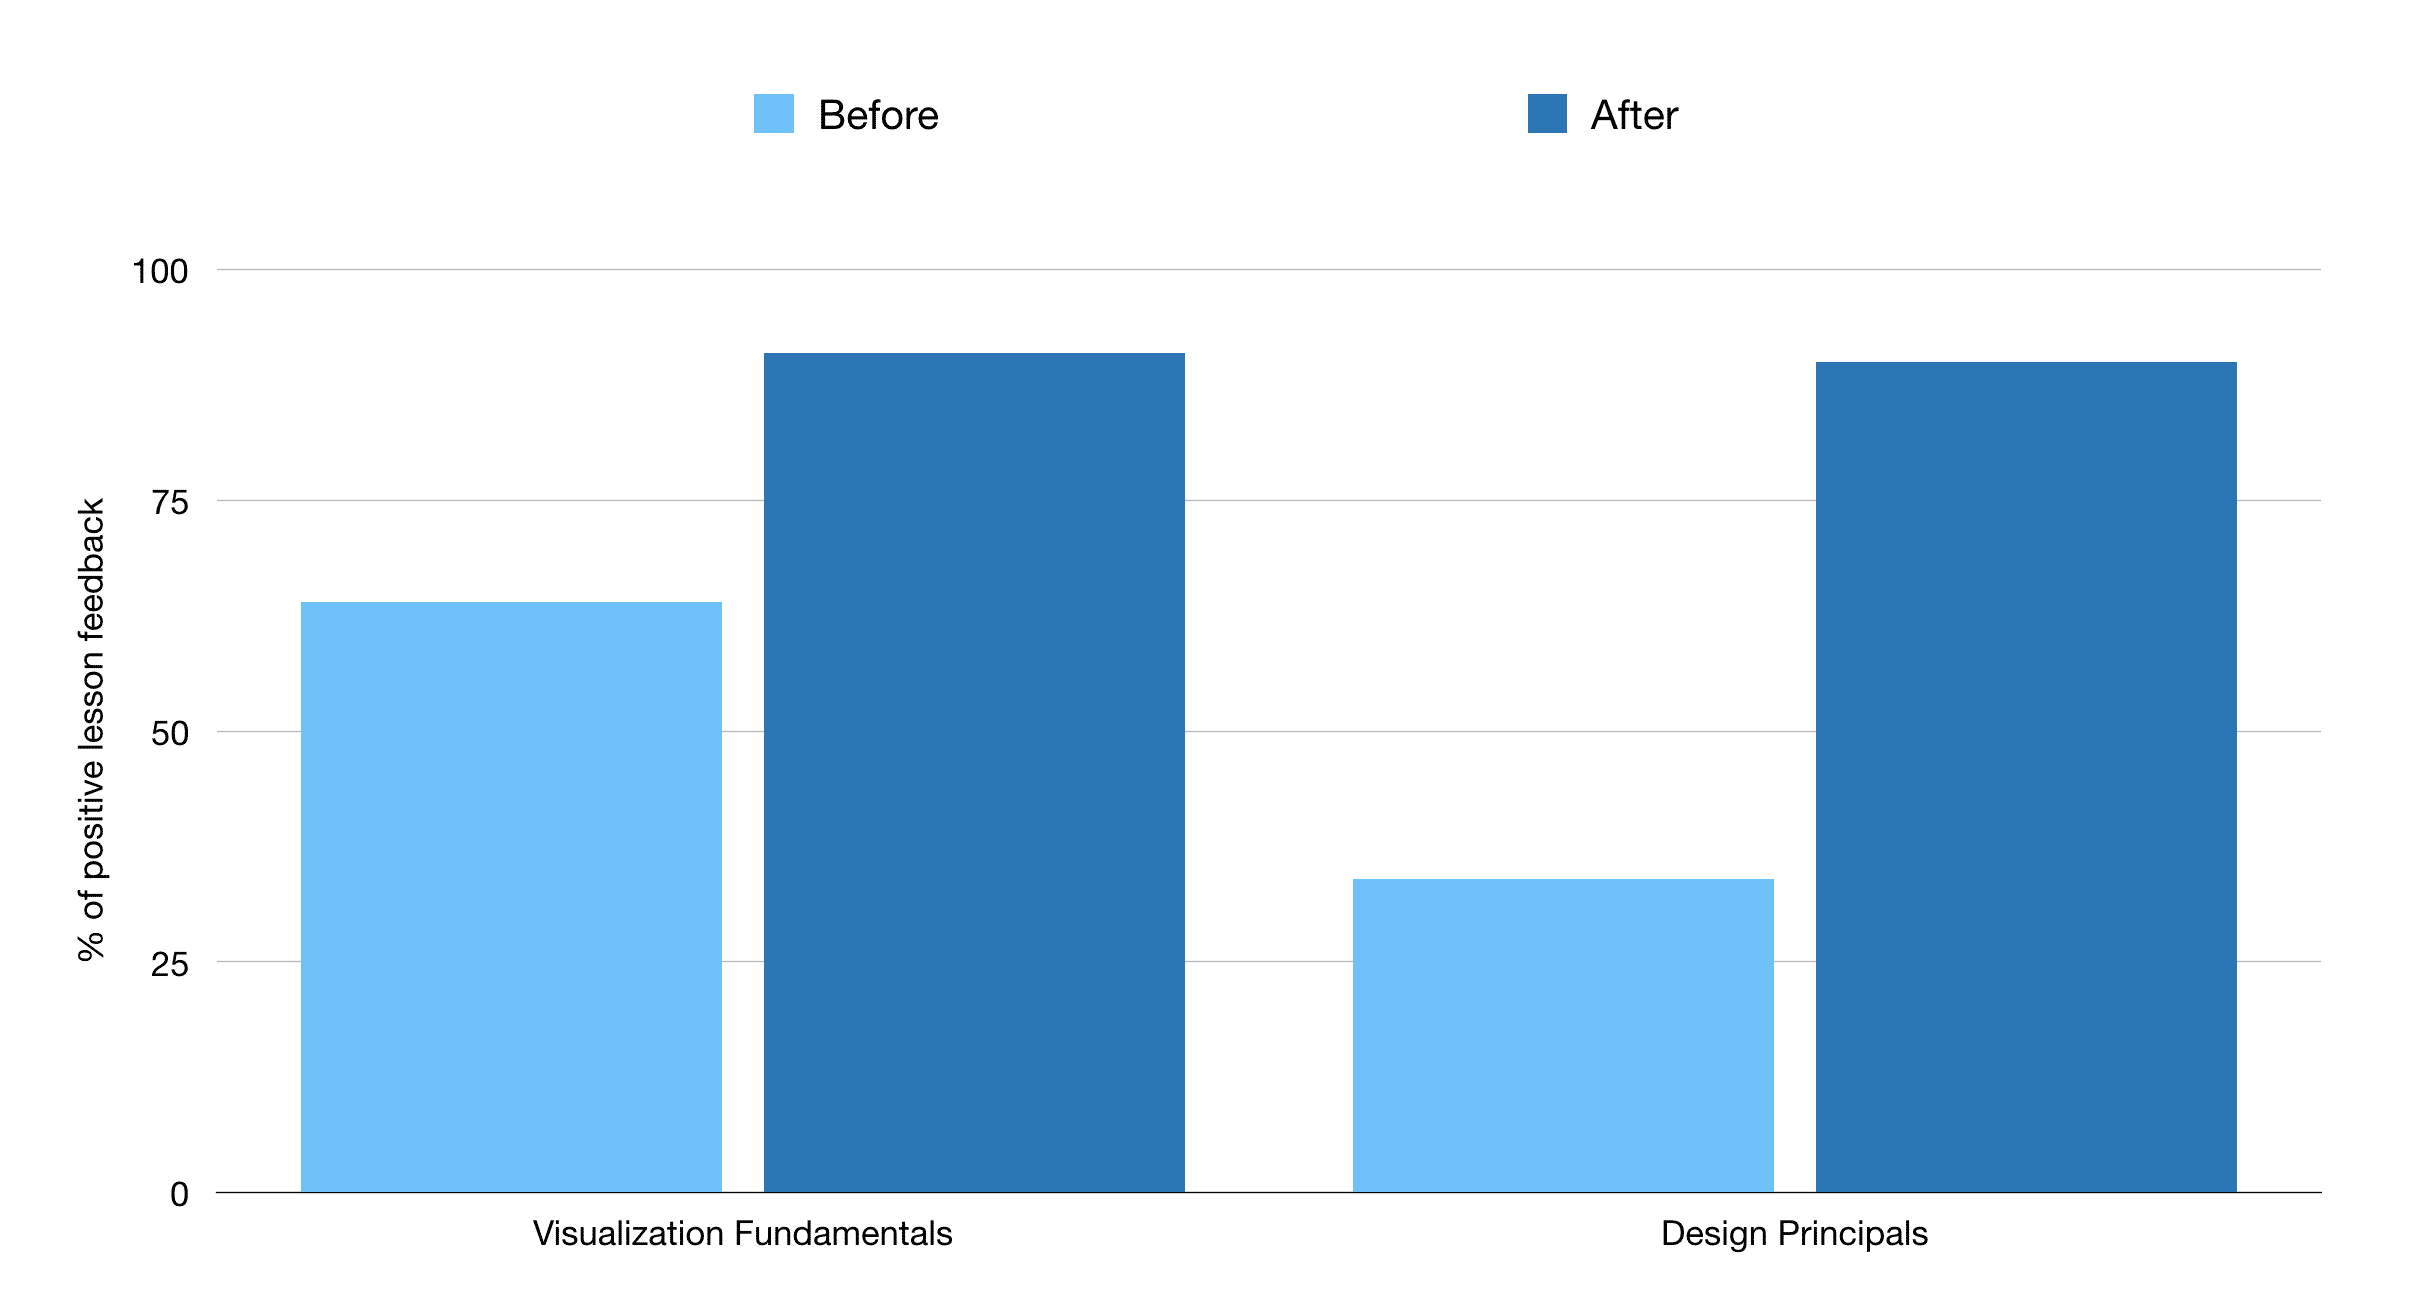
For example, in our Data Analyst Nanodegree program, we saw that two lessons—“Visualizing Fundamentals” and “Design Principles”—stood out in the signals. By acting on feedback indicating the lessons were hard to master and visually complex to understand, we were able to make significant improvements to the lessons.
Here is some of the content prior to the change:
And here we are after:
Within just a few days of rolling out the updates, we saw student feedback improve accordingly:
The beauty of this approach lies in its dynamism. Feedback comes in on an ongoing basis, and data is collected and analyzed continuously.
We iterate on our findings, and roll out improvements efficiently and effectively. We then monitor closely, and react accordingly. By establishing, maintaining, and constantly refining this feedback loop, we’re able to apply insights derived from millions of feedback signals in the service of offering the best learning experience possible. In embracing this approach, our students are empowered to play an active role in creating that experience, and our internal teams are empowered to do their best work.
Ultimately, we are a learning company, and just as our students learn, we learn.