Lesson 1

Intro to Statistics
Course
Get ready to analyze, visualize, and interpret data! Thought-provoking examples and chances to combine statistics and programming will keep you engaged and challenged.
Get ready to analyze, visualize, and interpret data! Thought-provoking examples and chances to combine statistics and programming will keep you engaged and challenged.
Beginner
Last Updated March 7, 2022
No experience required
Course Lessons
Lesson 2
2. Looking at Data
Lesson 3
3. Scatter Plots
Lesson 4
4. Bar Charts
Lesson 5
5. Pie Charts
Lesson 6
6. Programming Charts (Optional)
Lesson 7
7. Admissions Case Study
Lesson 8
Problem Set 1: Visualization
Lesson 9
8. Probability
Lesson 10
9. Conditional Probability
Lesson 11
10. Bayes Rule
Lesson 12
11. Programming Bayes Rule (Optional)
Lesson 13
11A. Probability Distributions
Lesson 14
12. Correlation vs. Causation
Lesson 15
Problem Set 2: Probability
Lesson 16
13. Estimation
Lesson 17
14. Averages
Lesson 18
15. Variance
Lesson 19
16. Programming Estimators (Optional)
Lesson 20
Problem Set 3: Estimators
Lesson 21
17. Outliers
Lesson 22
18. Binomial Distribution
Lesson 23
19A. Central Limit Theorem
Lesson 24
19. Central Limit Theorem Programming (Optional)
Lesson 25
20. The Normal Distribution
Lesson 26
21. Manipulating Normals
Lesson 27
22. Most Better than Average
Lesson 28
Problem Set 4
Lesson 29
23. Sebastian's Weight and Proofs (Optional)
Lesson 30
24. Confidence Intervals
Lesson 31
25. Normal Quantiles
Lesson 32
26. Hypothesis Test
Lesson 33
27. Hypothesis Test 2
Lesson 34
28. Programming Tests and Intervals (Optional)
Lesson 35
Problem Set 5: Inference
Lesson 36
29. Regression
Lesson 37
30. Correlation
Lesson 38
31. Monty Hall Problem (Optional)
Lesson 39
Problem Set 6: Regression and Correlation
Lesson 40
32. Weight Case Studies
Lesson 41
33. Flash Crash Example
Lesson 42
34. Challenger Example
Lesson 43
Final Exam
Taught By The Best

Sebastian Thrun
Founder and Executive Chairman, Udacity
As the Founder and Chairman of Udacity, Sebastian's mission is to democratize education by providing lifelong learning to millions of students worldwide. He is also the founder of Google X, where he led projects including the Self-Driving Car, Google Glass, and more.
The Udacity Difference
Combine technology training for employees with industry experts, mentors, and projects, for critical thinking that pushes innovation. Our proven upskilling system goes after success—relentlessly.

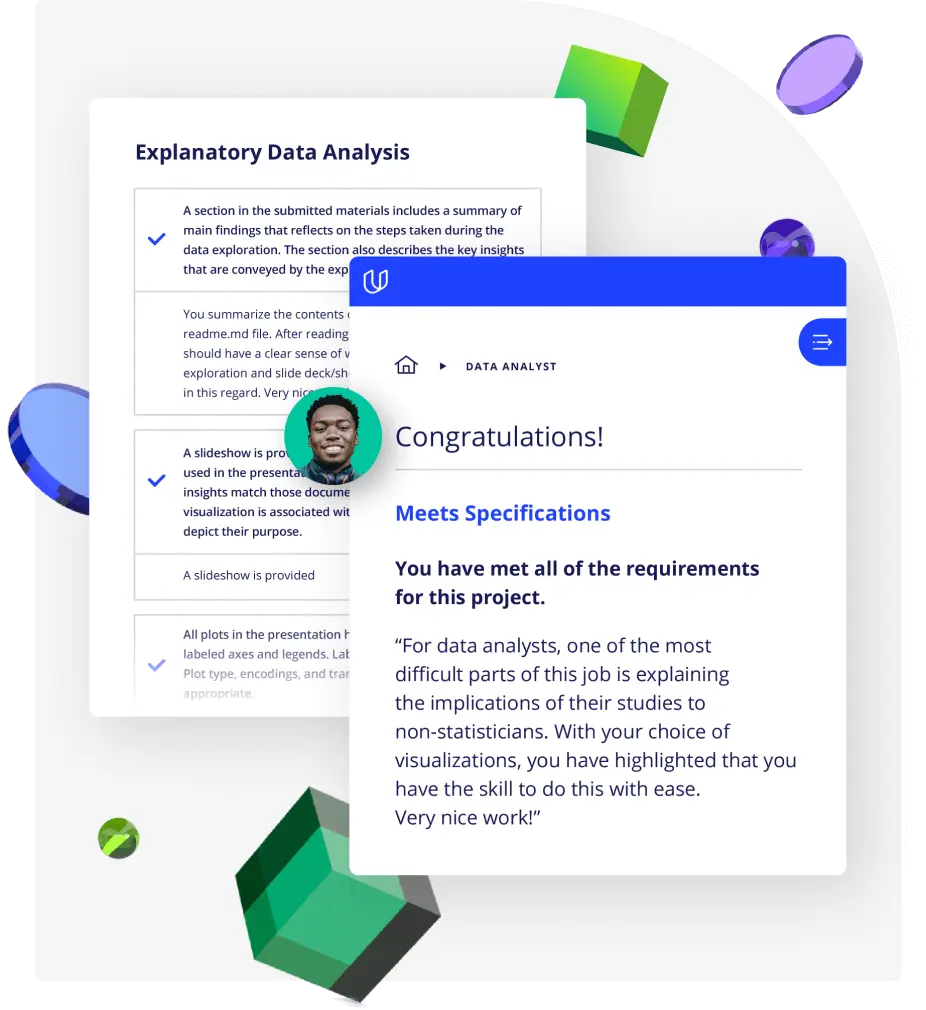
Demonstrate proficiency with practical projects
Projects are based on real-world scenarios and challenges, allowing you to apply the skills you learn to practical situations, while giving you real hands-on experience.
Gain proven experience
Retain knowledge longer
Apply new skills immediately

Top-tier services to ensure learner success
Reviewers provide timely and constructive feedback on your project submissions, highlighting areas of improvement and offering practical tips to enhance your work.
Get help from subject matter experts
Learn industry best practices
Gain valuable insights and improve your skills