Lesson 1
An Introduction to Your Nanodegree Program
Welcome! We're so glad you're here. Join us in learning a bit more about what to expect and ways to succeed.
Nanodegree Program
Our Data Analyst Nanodegree program will teach you how to clean up messy data, uncover patterns and insights, and communicate your findings. You'll start with an introduction to data analysis tools, including Jupyter Notebook, NumPy, pandas, and Matplotlib. Using these tools, you will ask questions about data and answer them through data collection, exploration, wrangling, and visualization. This intermediate-level program includes real-world projects where you will choose your own datasets, research questions, and analysis approach. As you progress through the program, each course will repeat the data analysis process while introducing more advanced techniques, such as applying data imputation to fill in missing data and applying appropriate encodings when developing data visualizations.
Intermediate
2 months
Real-world Projects
Completion Certificate
Last Updated August 30, 2024
Skills you'll learn:
Prerequisites:
Course 1 • 8 hours
Lesson 1
Welcome! We're so glad you're here. Join us in learning a bit more about what to expect and ways to succeed.
Course 2 • 3 weeks
Learn the data analysis process of questioning, wrangling, exploring, analyzing, and communicating data. You will work with data in Python using libraries like NumPy and pandas.
Lesson 1
Learn about the data analysis process and the Python packages used in this course
Lesson 2
Jupyter Notebooks are a great tool for sharing insights and visualizations alongside your code. This lesson covers how to create them and utilize their various features.
Lesson 3
Use the pandas library to load data, view its properties, and start asking data analysis questions
Lesson 4
Use the pandas library to perform data cleaning, filtering, and reshaping tasks. This includes troubleshooting issues with data as well as optimizing for memory usage and speed.
Lesson 5
Draw conclusions and communicate results to stakeholders by calculating statistics and creating basic data visualizations with the pandas library
Lesson 6 • Project
Choose one of Udacity's curated datasets, perform an investigation, and share your findings.
Course 3 • 3 weeks
Data wrangling is a set of processes for turning raw and messy data into a clean format to answer interesting questions from the data. In this course, you will learn the three phases of data wrangling: gathering, assessing, and cleaning data.
Lesson 1
You will learn what data wrangling is and why it matters. And you will see a real-world example of data wrangling and some common misconceptions about data wrangling.
Lesson 2
You will learn to implement data gathering methods to obtain and extract data from various sources and in several popular data formats.
Lesson 3
You will learn to identify different data quality and structural issues and apply visual and programmatic assessments to catch them.
Lesson 4
You will learn to remediate the issues you identified in the assessment stage and test that your data cleaning is successful.
Lesson 5 • Project
You will apply the skills you acquired in the course by gathering, assessing, and cleaning multiple real-world datasets of your choice.
Course 4 • 3 weeks
Learn to apply sound design and data visualization principles to the data analysis process. Learn how to use analysis and visualizations to tell a story with data.
Lesson 1
In this lesson, see the motivations for why data visualization is an important part of the data analysis process and where it fits in.
Lesson 2
Learn about elements of visualization design, especially to avoid those elements that can cause a visualization to fail.
Lesson 3
In this lesson, you will see how you can use matplotlib and seaborn to produce informative visualizations of single variables.
Lesson 4
In this lesson, build up from your understanding of individual variables and learn how to use matplotlib and seaborn to look at relationships between two variables.
Lesson 5
In this lesson, see how you can use matplotlib and seaborn to visualize relationships and interactions between three or more variables.
Lesson 6
Previous lessons covered how you could use visualizations to learn about your data. In this lesson, see how to polish up those plots to convey your findings to others!
Lesson 7 • Project
Choose a dataset, either your own or a Udacity-curated dataset, and perform an exploratory data analysis using Python. Then, create a presentation with explanatory plots that conveys your findings.
Senior Data Scientist
Josh is a Senior Data Scientist at Local Logic, where he models commercial real estate trends, acquisitions, and sustainable cities. He was formerly Assistant Professor of Data Analytics at Stonehill College, and was a postdoctoral researcher in nuclear physics at Lawrence Livermore National Laboratory.
AI Software Architect
Ria is an AI Software Architect and technical lead at Intel. She has a master's in data science from Harvard University, and is an accomplished industry speaker and instructor. She formerly served as Intel NEX’s AI Ethics Lead Architect, leading trustworthy AI product creation, and as a Teaching Fellow for Harvard Data Science. Ria has multiple patents and publications on AI and ethics, and enjoys contributing to open-source communities to advance innovation.
Principal Software Engineer
Matt is a Principal Software Engineer at SOCi. With a masters in Bioinformatics from SDSU, he utilizes his cross domain expertise to build solutions in NLP and predictive analytics.
Average Rating: 4.8 Stars
1,184 Reviews
Anonymous
January 23, 2023
It’s excellent for learning from the starch also it’s challenging in a good way!
miya M.
January 11, 2023
iLOVE IT
Nikita G.
January 3, 2023
It's very interesting for me to learn SQL and Python, thank you so much for your course!!!!
Mubarak A.
December 25, 2022
Very Well
Pedro F.
December 25, 2022
Good insights.
Combine technology training for employees with industry experts, mentors, and projects, for critical thinking that pushes innovation. Our proven upskilling system goes after success—relentlessly.
Demonstrate proficiency with practical projects
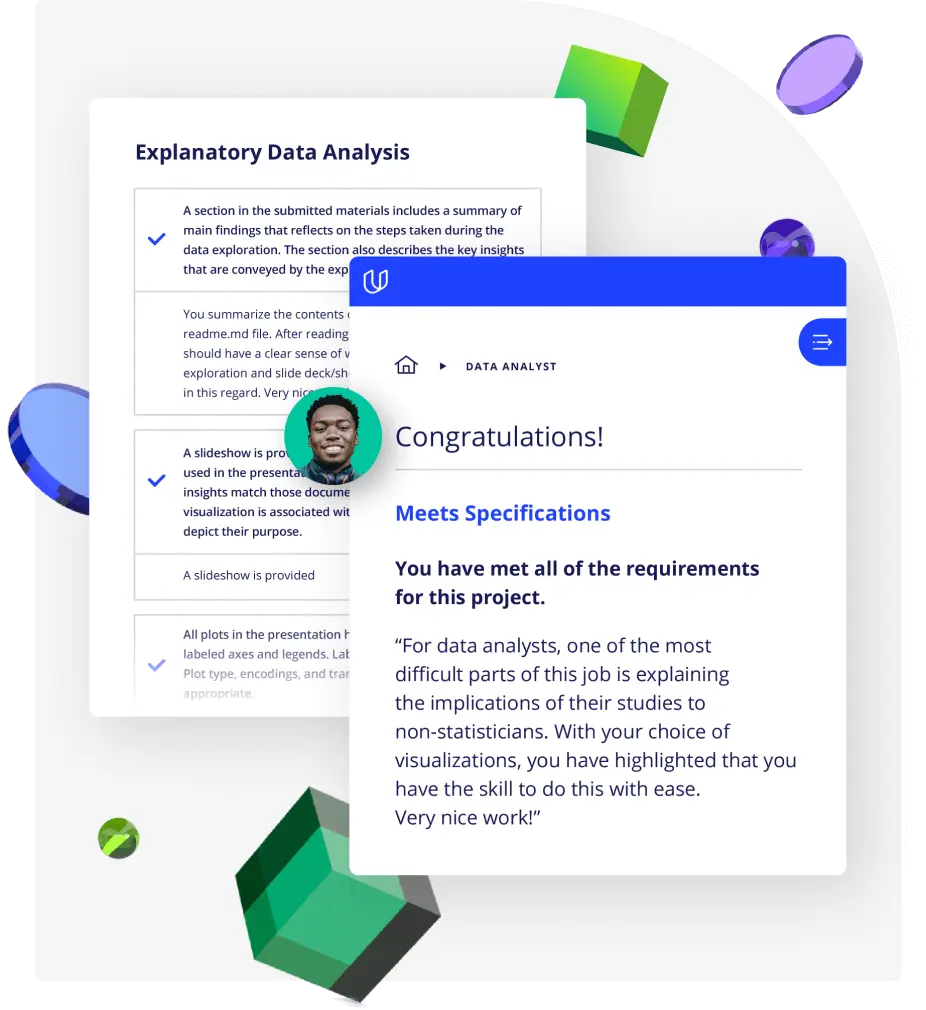
Projects are based on real-world scenarios and challenges, allowing you to apply the skills you learn to practical situations, while giving you real hands-on experience.
Gain proven experience
Retain knowledge longer
Apply new skills immediately
Top-tier services to ensure learner success
Reviewers provide timely and constructive feedback on your project submissions, highlighting areas of improvement and offering practical tips to enhance your work.
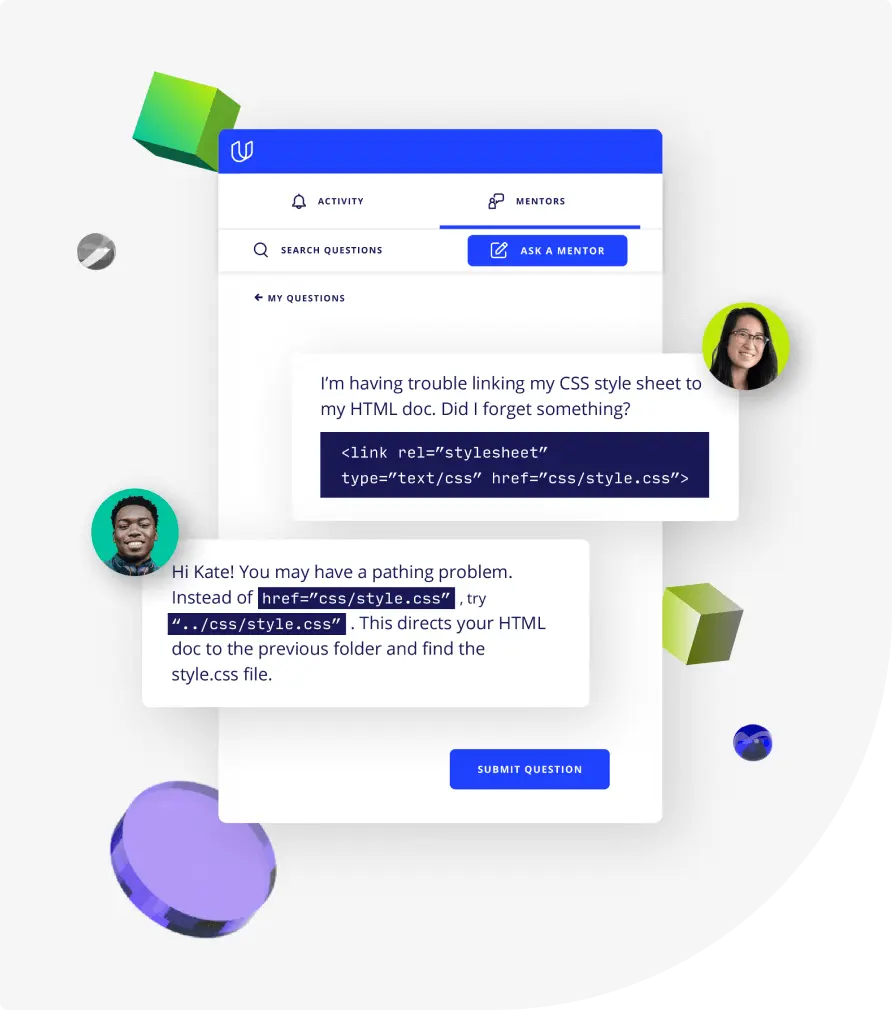
Get help from subject matter experts
Learn industry best practices
Gain valuable insights and improve your skills
Unlimited access to our top-rated courses
Real-world projects
Personalized project reviews
Program certificates
Proven career outcomes
Full Catalog Access
One subscription opens up this course and our entire catalog of projects and skills.
Average time to complete a Nanodegree program
(781)
3 months
, Advanced
2 months
, Beginner
(1194)
3 months
, Beginner
4 weeks
, Beginner
(80)
3 months
, Advanced
1 week
, Advanced
(807)
2 months
, Beginner
4 weeks
, Intermediate
3 weeks
, Intermediate
(124)
4 months
, Beginner
3 weeks
, Beginner
(47)
2 months
, Beginner
3 weeks
, Intermediate
1 month
, Beginner
(272)
2 months
, Intermediate
(88)
3 months
, Beginner
Our Data Analyst Nanodegree program is a meticulously crafted data analyst online course that imparts essential skills for cleaning up messy data, uncovering patterns and insights, making predictions with machine learning, and effectively communicating findings. This intermediate-level program involves real-world projects where learners can apply their skills in data visualization, exploratory data analysis, latent variables, and more. The curriculum includes hands-on experience with Python, Pandas, NumPy, as well as advanced data wrangling and visualization using Matplotlib and Seaborn. At Udacity, we empower our learners with practical, industry-relevant skills taught by professionals like Josh Magee, Ria Cheruvu, and Matt Maybeno. Our data analyst course is designed not just to impart knowledge but to ensure its application in real-world scenarios, enhancing both understanding and skill retention. Join us to advance your career in data analysis, where we provide the tools and support for your professional growth.