Skip to content

Data Analysis and Visualization with Microsoft Power BI

Nanodegree Program

Meet the growing demand for data analysis and visualization professionals by gaining the Power BI skills that top companies want.

Enroll Now
  • Estimated time
    3 Months

    At 5 hours/week

  • Enroll by
    May 31, 2023

    Get access to the classroom immediately upon enrollment

  • Skills acquired
    Data Visualization Design, Power BI Report Customization, DAX

What you will learn

  1. Data Analysis and Visualization with Microsoft Power BI

    Estimated 3 months to complete

    You’ll master the in-demand skills necessary to become a successful data analyst like data pre-processing, visualization and analysis using Microsoft Power BI as the primary tool.

    Prerequisite knowledge

    Microsoft Excel

    1. Introduction to Preparing and Modeling Data

      Where do you even start when the data you need for a single report lives in a bunch of different files and software systems? This is where preparing and modeling data becomes essential! This course is a crucial step in Power BI for anyone who needs to mash together multiple data sources, clean them, restructure them, and harmonize them into a single and efficient data model to support reporting. We’ll cover Power BI’s built-in Extract-Transform-Load (ETL) tool, Power Query, learn foundational data modeling principles, cover some introductory DAX (Data Analytics Expressions), and touch on troubleshooting and optimization.

    2. Creating Visualizations with Power BI

      In this course, students will learn how to carry Power BI beyond mere bar charts and transform their reports into data exploration & storytelling tools that companies can use to better understand their data. Students will start by learning about a variety of common and more advanced data visualizations. Then, students will learn how to design reports around these data visuals in order to focus user attention on key insights, help users navigate different features and report pages and enable accessibility options for diverse audiences. Next, the student will learn how to use filters and slicers. Finally, students will deliver a couple of advanced features capable of elevating how users navigate and engage with visuals and the report itself.

    3. Advanced Data Analysis

      In this course, students will focus on the techniques and skills needed for data analysis in Power BI. The course is centered around building a strong foundation and intuition of analytics so that students can take their skills beyond simply aggregating data in Power BI and into the realm of statistics, forecasting and strategy. We first start with an introduction to data analysis looking at different terms and techniques such as descriptive and inferential statistics, histograms, linear regression and an introduction to the concepts of correlation and probability. After taking the introductory lessons on data analytics, the course then moves to M, the language of Power Query, and learning to build custom formulas as part of the data transformation process. The overarching goal of the course is to help students become effective at the process of retrieving, analyzing and visualizing data in order to answer questions and draw conclusions.

All our programs include

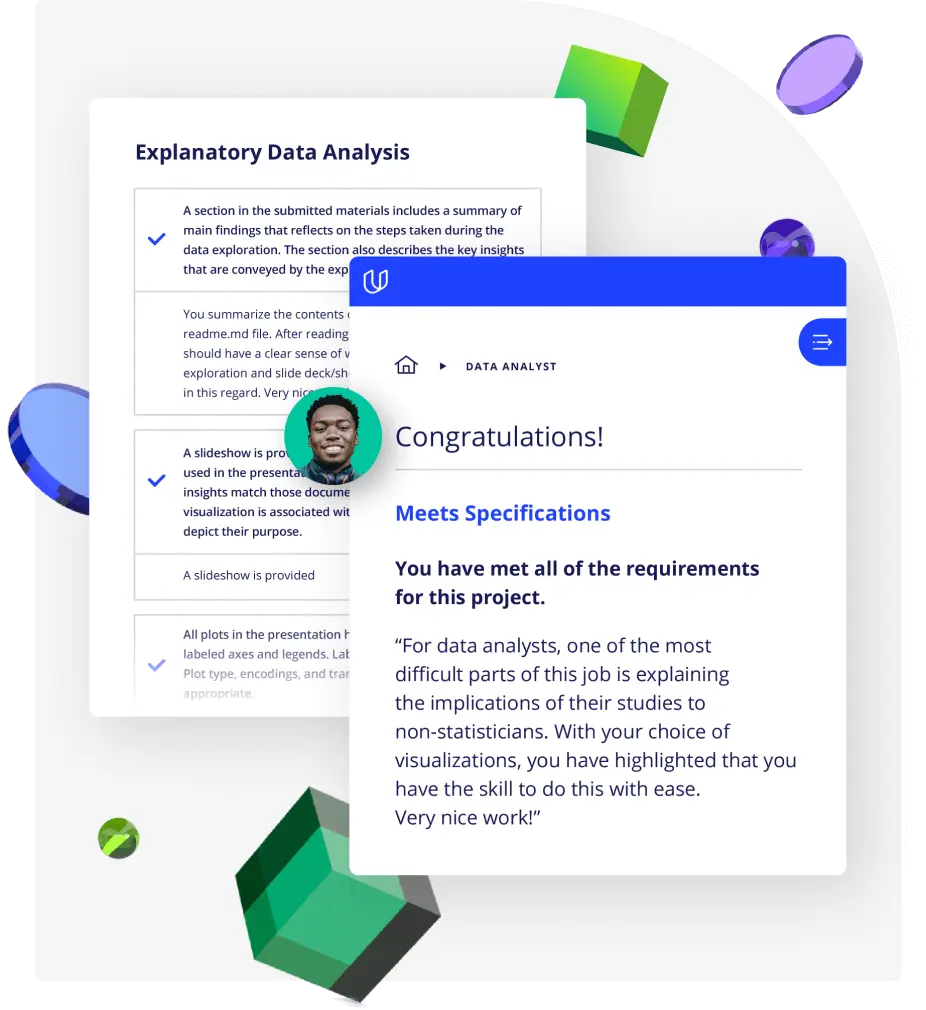
  • Real-world projects from industry experts

    With real-world projects and immersive content built in partnership with top-tier companies, you’ll master the tech skills companies want.

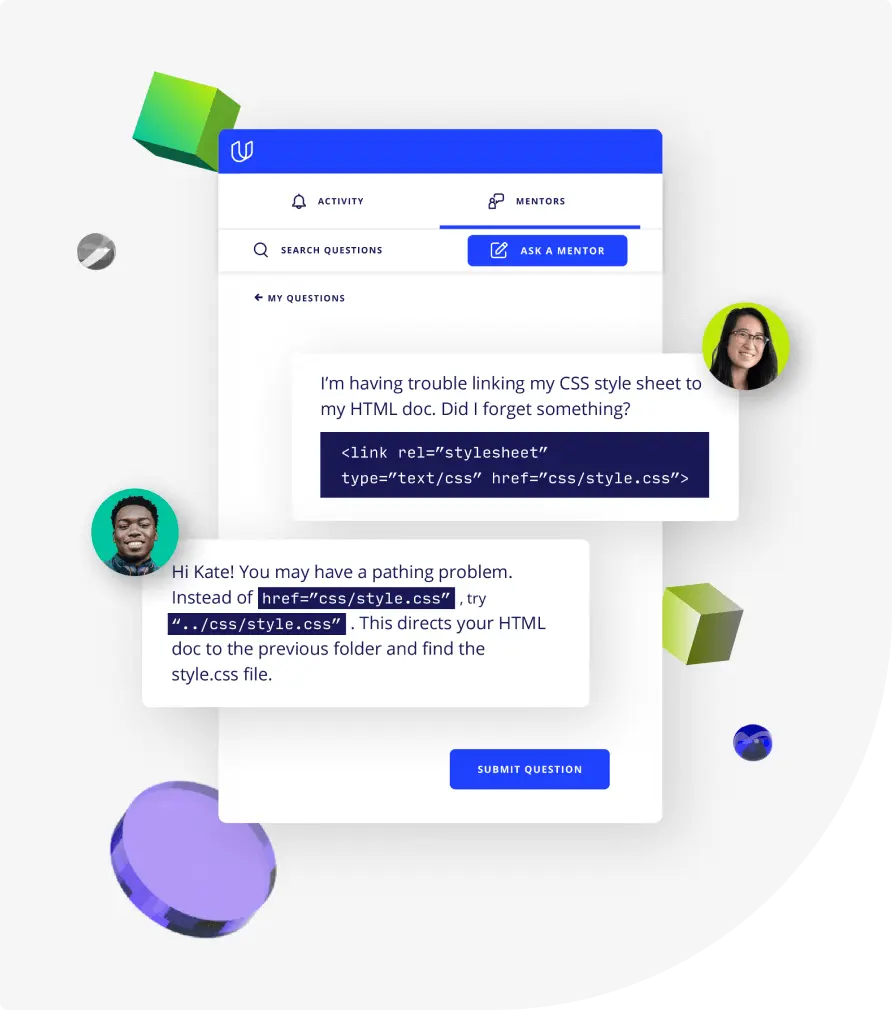
  • Real-time support

    On demand help. Receive instant help with your learning directly in the classroom. Stay on track and get unstuck.

  • Career services

    You’ll have access to Github portfolio review and LinkedIn profile optimization to help you advance your career and land a high-paying role.

  • Flexible learning program

    Tailor a learning plan that fits your busy life. Learn at your own pace and reach your personal goals on the schedule that works best for you.

Program offerings

  • Class content

    • Real-world projects
    • Project reviews
    • Project feedback from experienced reviewers
  • Student services

    • Student community
    • Real-time support
  • Career services

    • Github review
    • LinkedIn profile optimization

Succeed with personalized services.

We provide services customized for your needs at every step of your learning journey to ensure your success.

Get timely feedback on your projects.

  • Personalized feedback
  • Unlimited submissions and feedback loops
  • Practical tips and industry best practices
  • Additional suggested resources to improve
  • 1,400+

    project reviewers

  • 2.7M

    projects reviewed

  • 88/100

    reviewer rating

  • 1.1 hours

    avg project review turnaround time

Learn with the best.

Learn with the best.

  • Lenore R Flower

    Senior Business Intelligence Specialist

    Lenore is a Senior Business Intelligence Specialist with a background in finance and a passion for empowering her colleagues to make data-driven decisions—even if the information they have to work with is a little rough around the edges.

  • Sean Chandler

    Senior Business Intelligence Engineer at Humana

    Sean is a Senior Business Intelligence Engineer at Humana, where he oversees an enterprise community of thousands of users & developers. His Power BI work has been featured recently at the Microsoft Business Applications Summit and on Microsoft Mechanics.

  • Joseph Lozada

    Business Intelligence and Operations Professional

    Joseph works as a client services team leader at Morneau Shepell, where he manages a team of analysts and oversees the data management and systems functionality for his clients. He also works as an adjunct instructor of Excel and Power BI analytics at the Community College of Rhode Island.

Data Analysis and Visualization with Microsoft Power BI

Get started today

    • Learn

      Learn in-demand skills in data pre-processing, visualization and analysis using Power BI as the primary tool.

    • Average Time

      On average, successful students take 3 months to complete this program.

    • Benefits include

      • Real-world projects from industry experts
      • Real-time classroom support
      • Career services

    Program details

    Program overview: Why should I take this program?
    • Why should I enroll?

      The data analysis and visualization market is on the rise—Microsoft Power BI helps enterprises make informed, data-driven decisions, and therefore is extremely valuable to more and more top companies.

    • What jobs will this program prepare me for?

      The need for a better data visualization in an enterprise organization is greater than ever. The skills you will gain from this Nanodegree program will qualify you for roles like business intelligence analyst, business analyst or data analysts.

    • How do I know if this program is right for me?

      The course is for individuals who are looking to advance their data analysis careers with the cutting-edge skills of interacting with data and turning it into insights more easily.

    Enrollment and admission
    • Do I need to apply? What are the admission criteria?

      No. This Nanodegree program accepts all applicants regardless of experience and specific background.

    • What are the prerequisites for enrollment?

      A well-prepared learner is already able to:

      • Use Microsoft Excel to organize and analyze data, including the use of basic functions (SUM, DIVIDE, AVERAGE, etc.) and creating basic formulae (a + b = c, for example)
      • Create a table in Microsoft Excel, including filtering using column headers
      • (Optional but beneficial) Create and use basic pivot tables in Microsoft Excel for data analysis
    • If I do not meet the requirements to enroll, what should I do?

      If you aren’t comfortable with the prerequisites above, we recommend taking our beginner Marketing Analytics Nanodegree program first.

    Tuition and term of program
    • How is this Nanodegree program structured?

      The Data Analysis and Visualization with Microsoft Power BI Nanodegree program is comprised of content and curriculum to support three projects. We estimate that students can complete the program in three months, working 5 hours per week.

      Each project will be reviewed by the Udacity reviewer network and platform. Feedback will be provided and if you do not pass the project, you will be asked to resubmit the project until it passes

    • How long is this Nanodegree program?

      Access to this Nanodegree program runs for the length of time specified above. If you do not graduate within that time period, you will continue learning with month-to-month payments. See the Terms of Use and FAQs for other policies regarding the terms of access to our Nanodegree programs.

    • Can I switch my start date? Can I get a refund?

      Please see the Udacity Program FAQs for policies on enrollment in our programs.

    Software and hardware: What do I need for this program?
    • What software and versions will I need in this program?

      Learners will need the Windows operating system, and will need to download and install free Power BI Desktop software. The hardware/OS requirements listed are:

      • Supported Operating System: Windows 10, Windows Server 2012 R2, Windows Server 2012, Windows 8, Windows 8.1, Windows Server 2016, Windows Server 2019, Windows 11
      • Microsoft Power BI Desktop requires Internet Explorer 10 or greater and Microsoft Power BI Desktop is available for 32-bit (x86) and 64-bit (x64) platforms.

    Data Analysis and Visualization with Microsoft Power BI

    Enroll Now